Table of Contents
What is Doji Candlestick
Doji candlestick is a formation that happens when a market’s open price and close price are almost the same.To sum up in one word, Doji Candlestick pattern represents ‘uncertainingty’ in the markets. This candlestick pattern can lead to high profits in trading when coupled with trend after which this is formed. The versatility of this candlestick pattern is recognized by all the traders for different time frames.
How is a Doji Pattern formed
The Doji Pattern is developed when the market opens and bullish traders push prices up whereas the bearish traders deny the higher price and push it back towards down.
It could also be that bearish traders try to push prices as low as possible, and the bullish traders try to resist and push the price up.
The upward and downward movements that occur between open and close will form the wick. The body is developed when the price closes at or almost the same level as it opened.
How to use Doji candlestick pattern represent
Doji represents uncertainity in the markets after a strong directional move. Kindly note that Doji candles formed in sideways markets (when markets not going any direction) is of not much significance.However, when formed after a strong directional move, it represents an uncertaininty in minds of traders whether current directional move is going to continue or a reversal will happen.
For example , after a strong bearish move if series of doji candles start to appear , its an early sign that reversal may occur. Kindly note that doji doesn not confirm that reversal will happen , its just an indicator of uncerainity after the current move and possibility of either reversal or continuation. Next few candles after doji confirms whether its reversal of current trend or continuation of current trend.
Related Post: Introduction to Candlestick Patterns
Types of Doji Candlestick Pattern
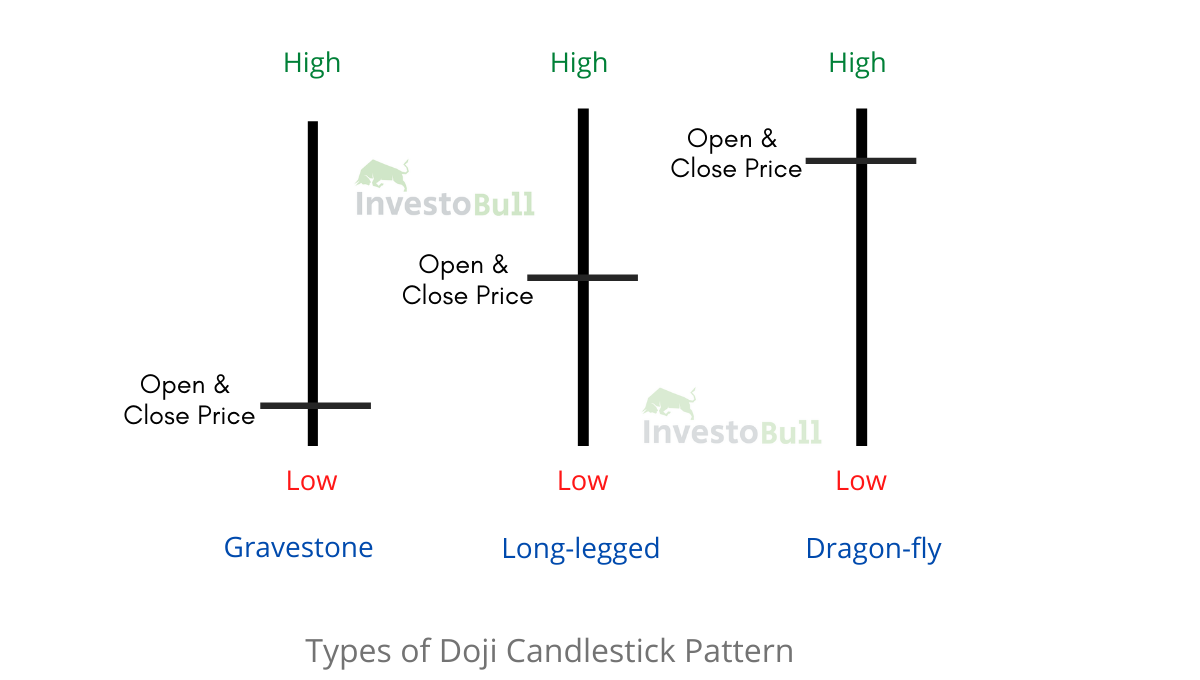
Doji patterns are rendered by differing positions and length of shadows, so traders have given different names to different shadow arrangements.
There are mainly 3 types of Doji candlestick patterns, which are Long-Legged Doji, Dragonfly Doji and Gravestone Doji.
Related Post: What is Dark Cloud Cover Candlestick Pattern
Long-legged Doji Candlestick Pattern
Long-legged doji intimates uncertainty in the market with high activity. As with the doji star, the pattern works best when it follows a strong directional move, but it only represents the early signs of a reversal.
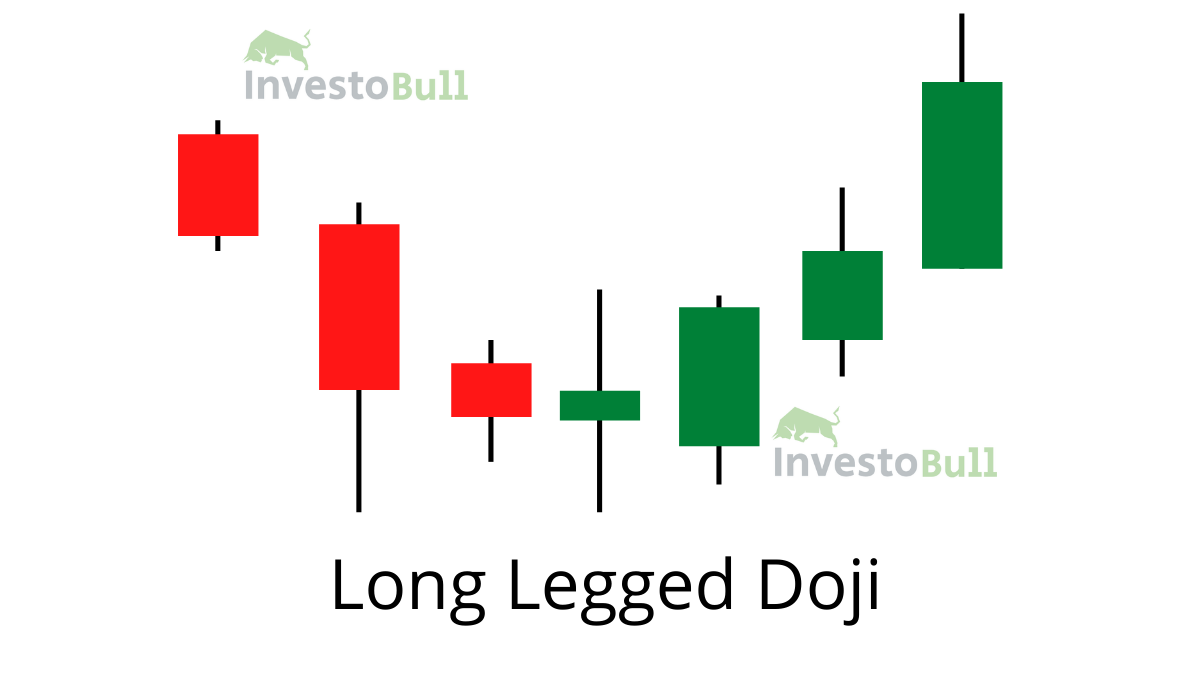
In the long-legged doji, the market may go bullish or bearish so it is not recommended to trade until the market does not indicate towards a particular direction.
Dragonfly Doji Candlestick Pattern
Dragonfly doji appears like the letter “T” and is most stable when it appears after a significant downtrend.
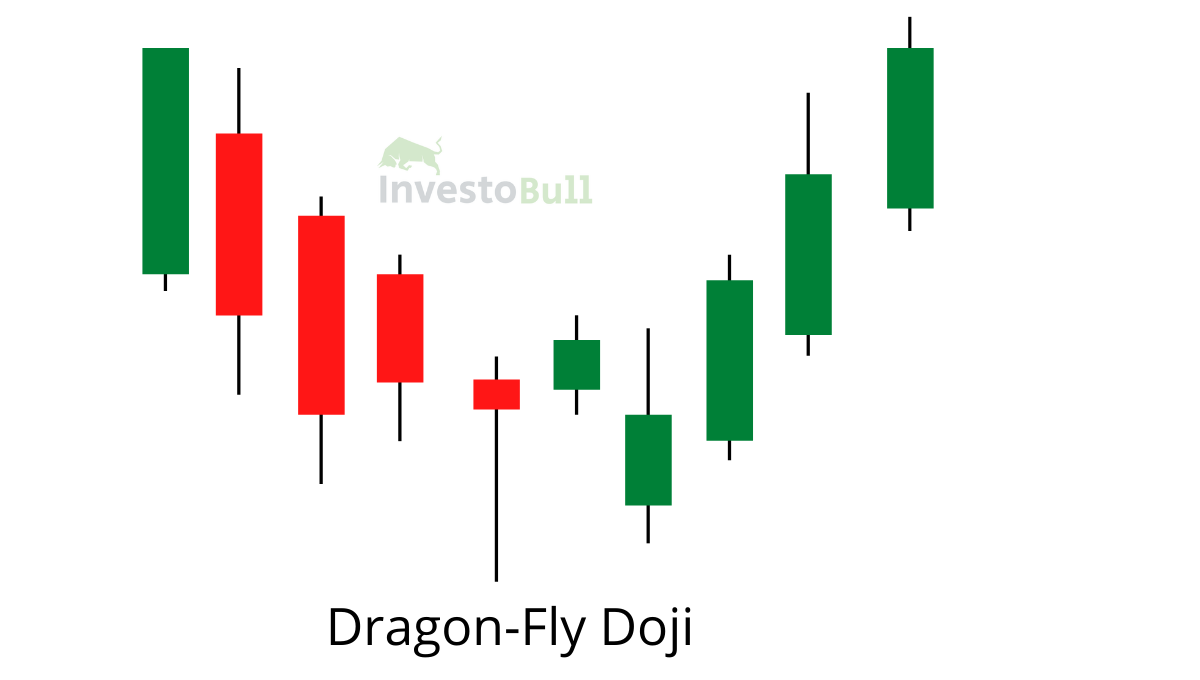
After opening lower, the doji signals that bulls reacquired control over the price and will likely remain in control of the following session.
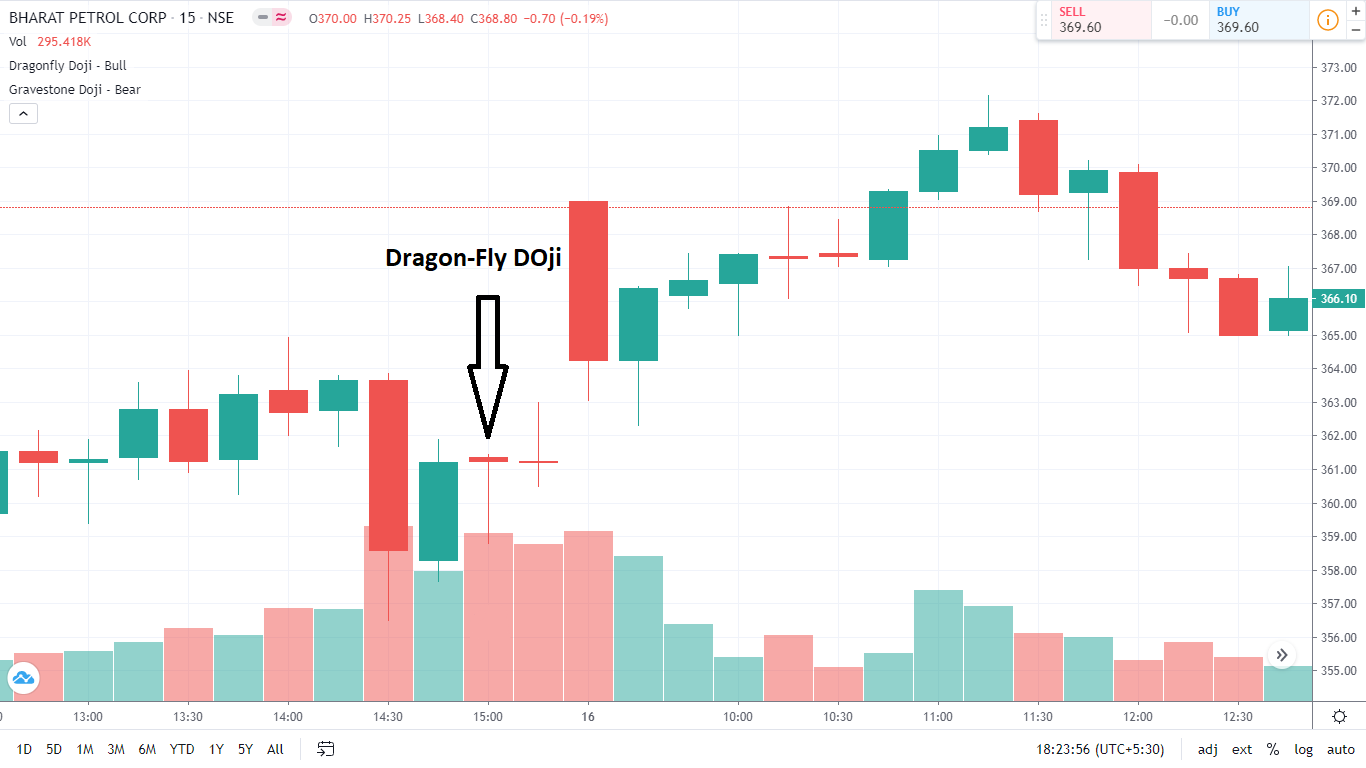
When you see a dragonfly doji after a Bearish trend, you should buy the stock when a candle closes above the tiny body of the dragonfly doji. A stop loss should be placed on the top of the bearish candle before Dragonfly doji.
Gravestone Doji Candlestick Pattern
Gravestone doji appears like an inverted letter “T” and is most reliable when it appears after a significant uptrend. After opening higher, bulls lose control over the price and bears take over throughout the session.
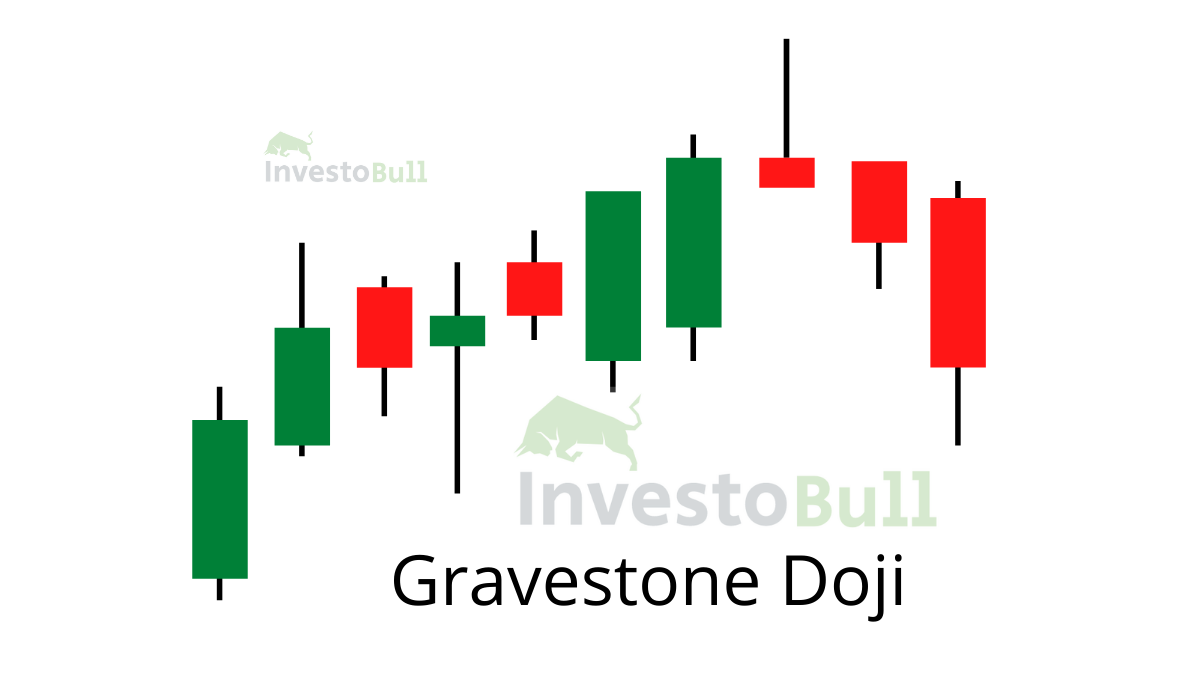
When you see a gravestone doji after a bullish trend, you should sell the stock when a candle closes below the tiny body of the gravestone doji.
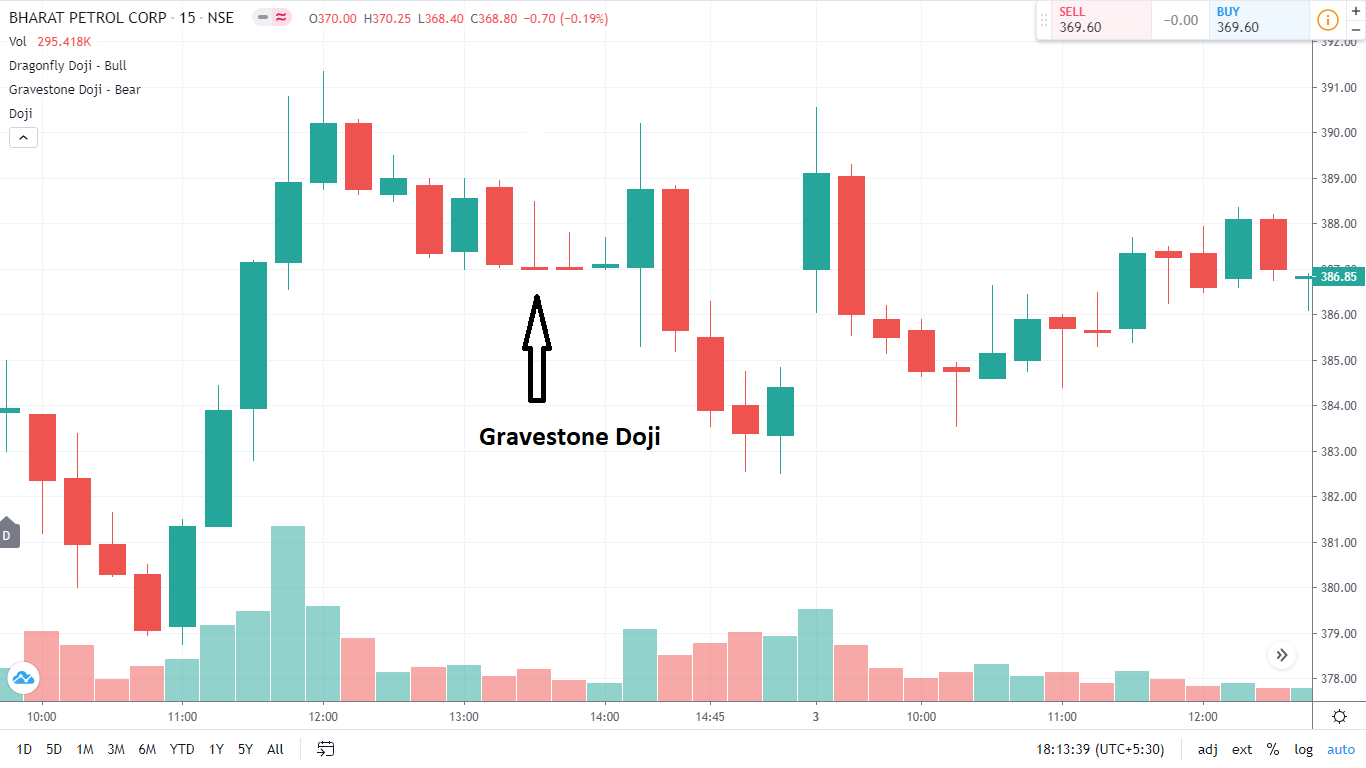
A stop loss should be placed above the highest point of the candlestick for every gravestone doji.
When you are trading in Doji Candlestick patterns, it’s necessary to take the previous trend and volume into consideration.
The most reliable trading signals are generated following a strong previous trend with higher than the average volume during the doji session. It’s also a great idea to examine other technical analysis for confirmation, such as trend line support or resistance levels.

Conclusion
Doji Candlestick Pattern shows uncertainty in the market. Depending on the length of the shadow and other factors, the uncertainty can change to an immediate reversal in price or a small suggestion that a reversal will eventually happen.
The solution is to look at the previous trend and volume for circumstances, as well as using doji candlestick patterns in combination with other forms of technical analysis that can help as confirmation.
FAQs
Recommended Brokers
 | No 1 STOCKBROKER IN INDIA Zerodha Free equity & mutual fund investments | Flat ₹20 intraday and F&O trades | Rating ★★★★★ | APPLY NOW |
 | GET FREE DEMAT ACCOUNT Upstox Fix brokerage of Rs. 20 per trade | Rating ★★★★ | APPLY NOW |
 | GET FREE DEMAT ACCOUNT Angel Broking 0 Brokerage on Equity Delivery | Rs 20 per order for Intraday and F&O trades | Rating ★★★★★ | APPLY NOW |