Traders use double top and double bottom chart patterns to recognize the possible trading signals. They represent a reversal from the current trend. In technical analysis, these are the best indicators. Also read : Introduction to Chart Patterns Double top ...
The Bullish Harami and Bearish Harami is two candlesticks pattern which indicates at a bullish reversal in the stock market. Bullish Harami Candlestick pattern The Bullish Harami candle pattern is a reversal pattern looking at the bottom of a downtrend. ...
Morning Star Candlestick Pattern The Morning Star pattern is a three-candle, bullish reversal candlestick pattern that appears at the bottom of a downtrend. It reveals a slowing down of downward momentum before a large bullish move lays the foundation for ...
What is Doji Candlestick Doji candlestick is a formation that happens when a market’s open price and close price are almost the same.To sum up in one word, Doji Candlestick pattern represents ‘uncertainingty’ in the markets. This candlestick pattern can ...
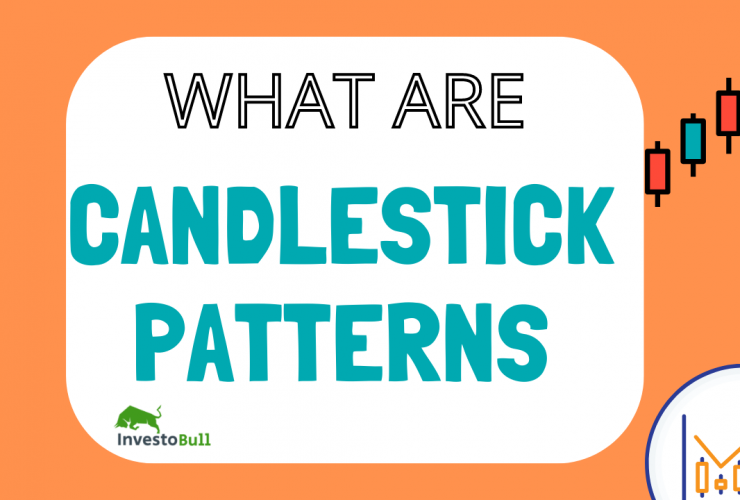
What are Candlestick Patterns The candlestick is used to identify trading patterns. These patterns help the technical analyst to set up a profitable trade. The patterns are formed by a grouping of two or more candles in a certain sequence. ...
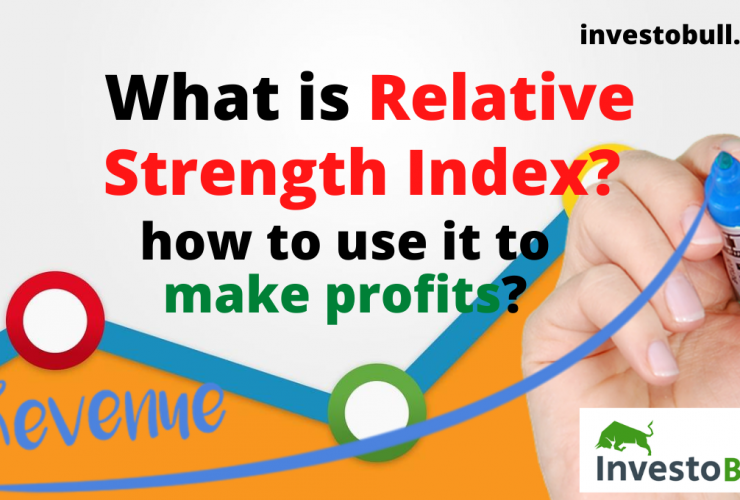
One of the most popular indicators used in modern-day trading to book more profits is RSI or Relative Strength Index. RSI is a leading indicator that is used to predict where to buy and sell the shares to get the ...

The most important step when you want to start trading or investing is Open demat account and trading account. Zerodha demat account is undoubtedly the best demat account in India with over 35 lakh clients . Zerodha has best Mobile ...
This article aims to give you the idea about some of the very important financial ratios which everyone should look into before doing any investments into a company. As we know fundamental analysis is a quite regressive process and needs ...

In this article we will understand in detail about the Free Cash Flow concept, how it is calculated and what are the key insights it provides about the status of the company. What is Free Cash Flow Free cash flow ...
Triangle chart patterns are a technical analysis tool used by traders to identify the future price movement. A triangle pattern is formed by drawing trend lines using a converging prices range. Triangle patterns are the similar to wedge patterns , ...