To become a profitable trader, you must know how to do technical analysis and reading charts. Technical analysis is the study of past data on charts and this analysis will help you to understand what is happening in the market , as well as predict future price movements. In this article you can fin best technical indicators in India with all the details.
Technical analysis is based on share price or volume data. Technical analysts use chart patterns, support and resistance levels, etc. to find the market trend.
Table of Contents
What are technical Indicators
Technical Indicators, a part of Technical Analysis tools, these are used to recognize the past trend and predict the future movements. Just as doctors use thermometers to gauge body temperature, technical analysts use indicators to gauge market conditions. Active traders commonly use technical indicators with the purpose of short term price movement analysis. Moreover, long-term investors use these indicators to recognize the entry and exit points. Here are the few technical indicators we are going to discuss: moving average, relative strength index, Pivot Point, VWAP, and Bollinger Bands.

Best Technical Indicators in India
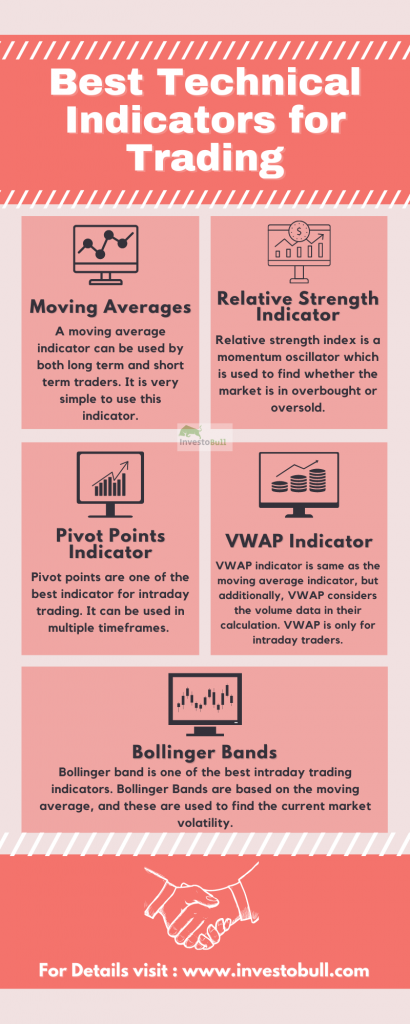
There are different types of technical indicators used by investors, but here are the list of best technical analysis indicators which are most popular among traders
- Moving Average
- Relative Strength Indicator
- Pivot Point
- VWAP (Volume Weighted Average Price)
- Bollinger Bands
Moving Averages
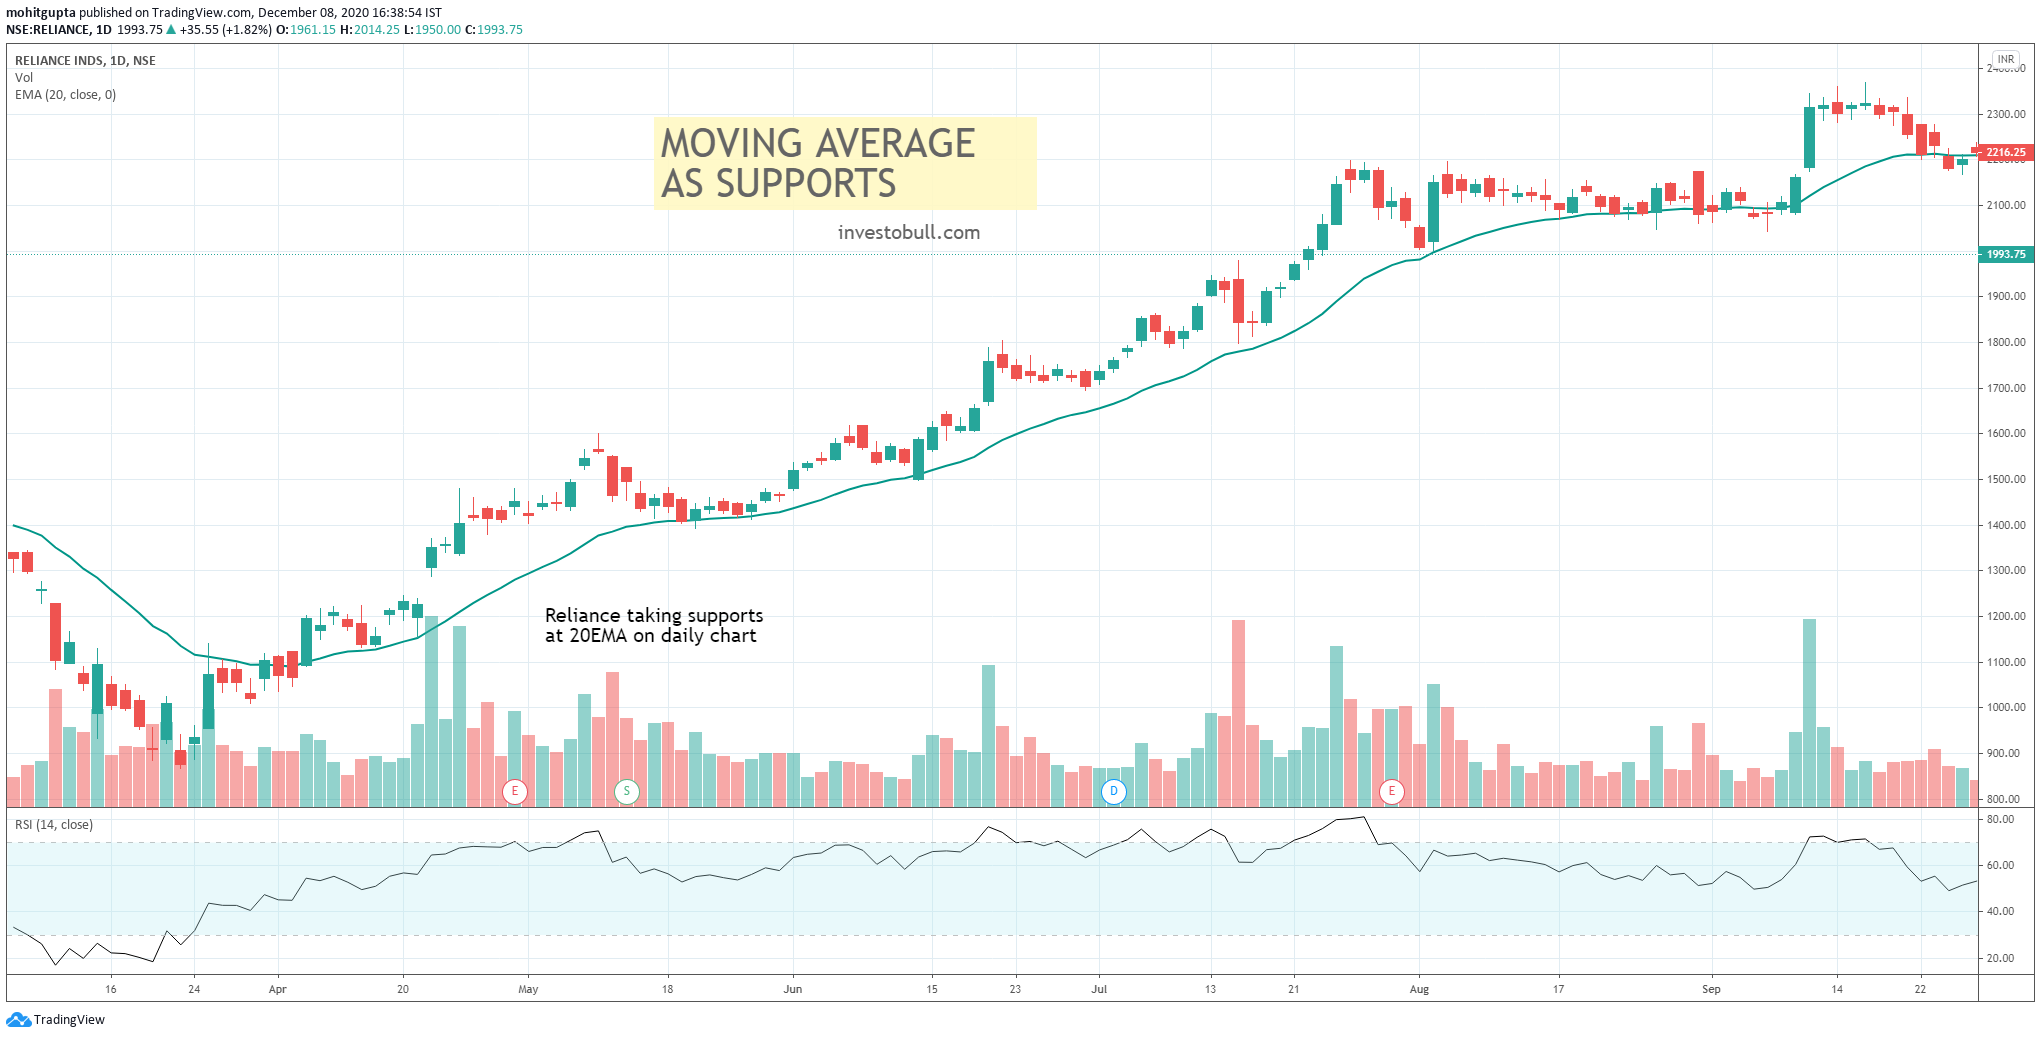
Moving Average is one of the best indicators and is also widely used for trading. A moving average indicator can be used by both long term and short term traders. It is very simple to use this indicator. Moving averages describe the closing price average of the previous n-period. It is used to find the market trend..
A moving average are primarily of two types-
- Simple Moving Average
- Exponential Moving Average
A simple moving average can be calculated by using the average of the last n-period closing price. It is very easy to use a simple moving average indicator. If the simple moving average is moving up, then the trend is upward and similarly, if the simple moving average is moving downward, then the trend will move downwards. A simple moving average indicator cannot change for small price movements.
Formula
SMA= (A1+A2+A3+…+An)/n
An exponential moving average is also calculated by using the average of last n periods closing price. An exponential moving average indicator can change for small price movement.
Formula
EMA(current) = ( (Price(current) – EMA(previous) ) x Multiplier) + EMA(previous)
How to use Moving Average Indicator
The moving average is one of the best technical analysis tools used by a professional trader to earn good profits. Moving Average is a momentum-based indicator.
Traders use Moving Average in multiple ways
- It is used to find the stock trend(Upward, Downward or Sideways
- It is used to find support and resistance
- It is used in crossover strategy
Relative Strength Indicator (RSI)
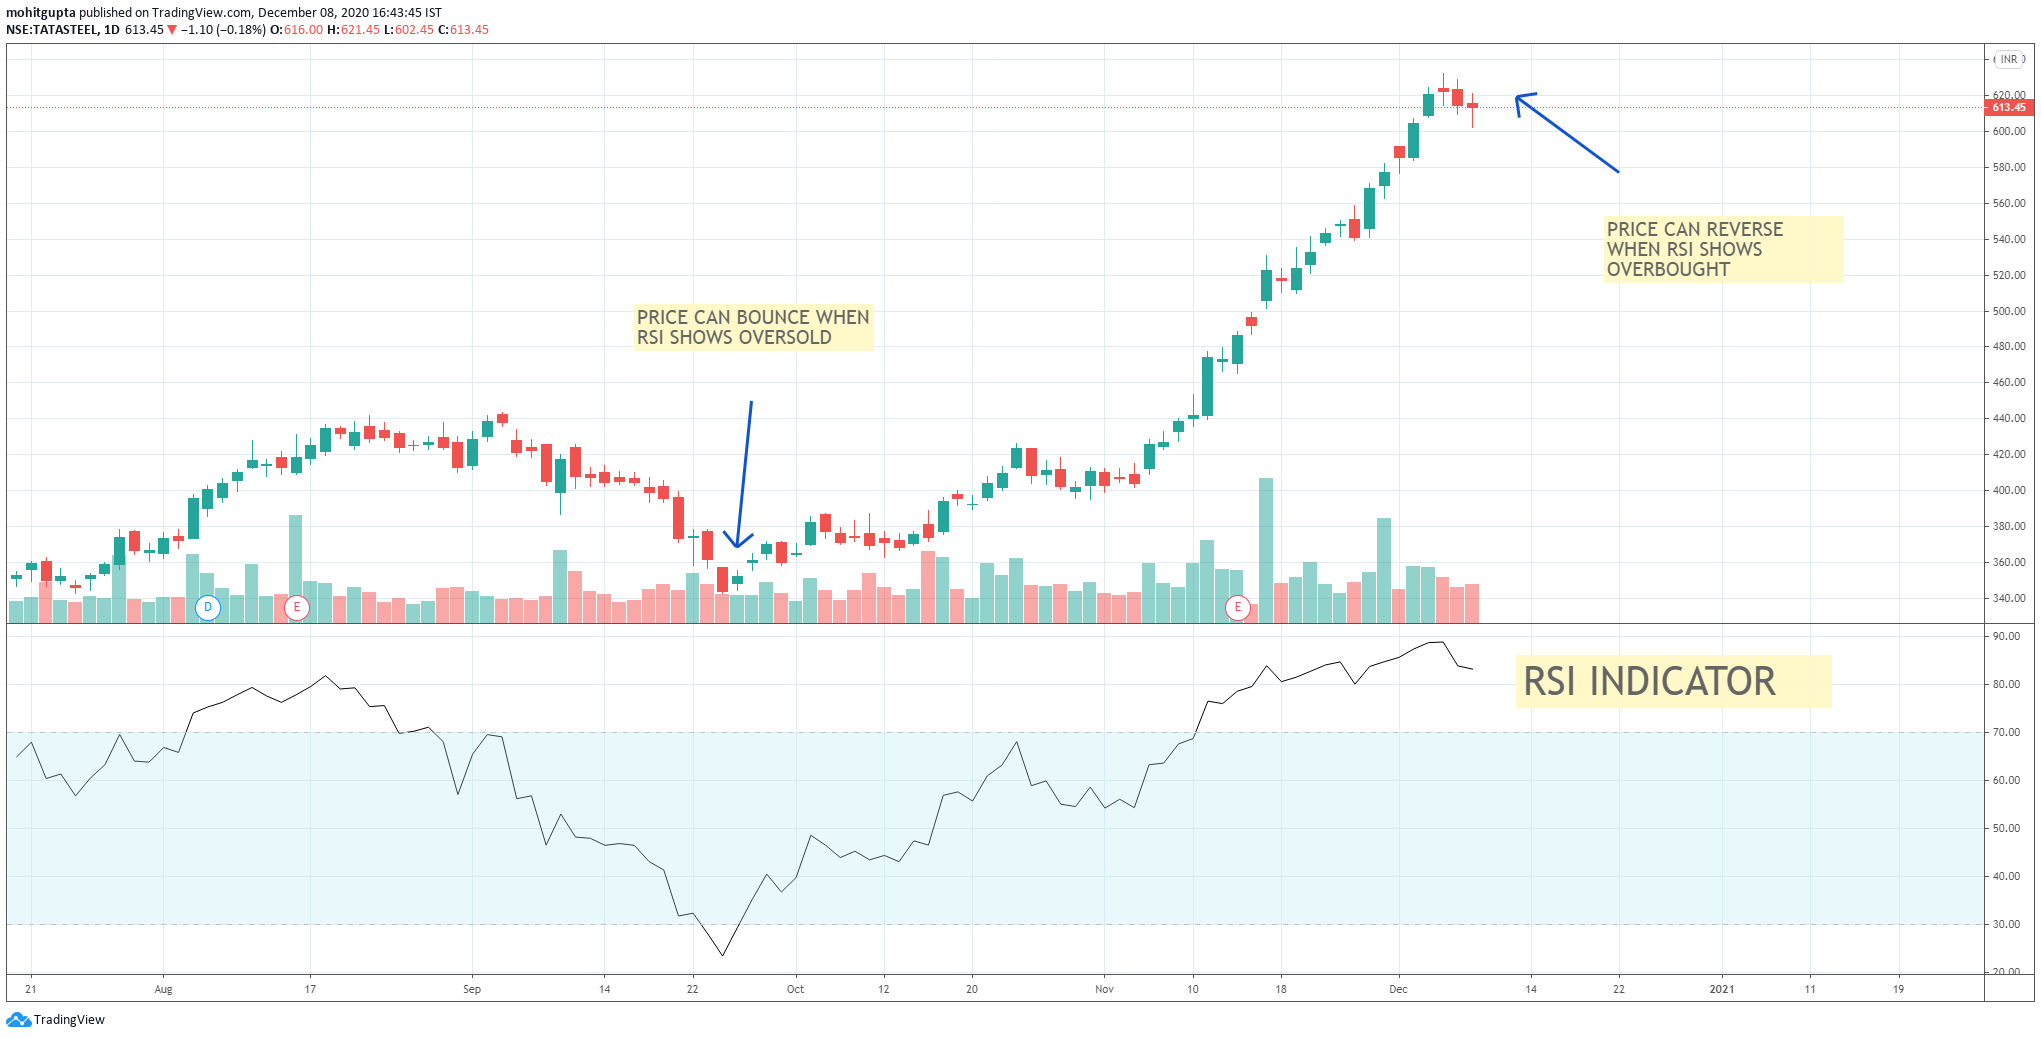
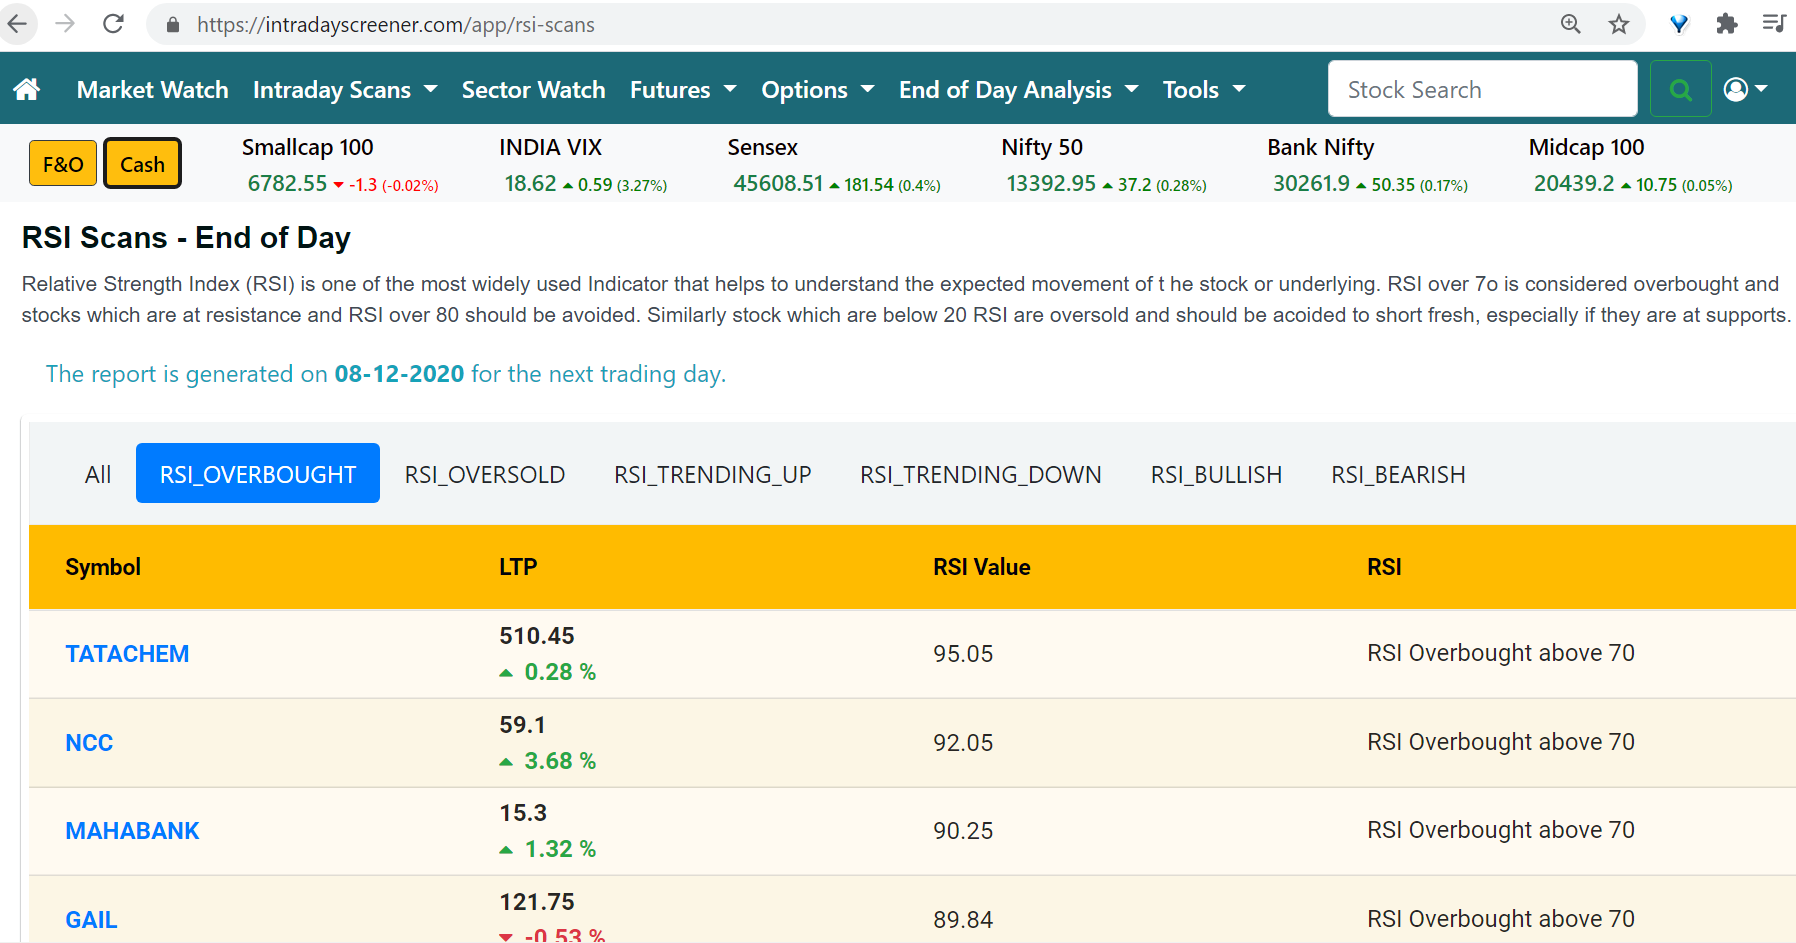
Relative strength index was developed by Welles wilder in 1978. It is one of the best technical indicators for intraday trading. Relative strength index is a momentum oscillator which is used to find whether the market is in overbought or oversold. A market is considered as overbought when the relative strength index is above 70 and oversold when the relative index is below 30.
RSI Formula
RSI = 100 – 100 / ( 1 + RS )
RS = Relative Strength = Avg Upward movement / Avg Downward movement
Avg U = average of all upward movements in the last N periods
Avg D = average of all downward movements in the last N periods
N = RSI Period
How to use Relative Strength Indicator
- It is used to find the market trend.
- It is used to find overbought and oversold stocks.
- RSI has a range of 0 to 100 bands. If the trend is above 50, then it is an uptrend, and similarly, if the movement is below 50, it is a downtrend.
- The full form of RSI is the Relative Strength Index. It is the same as Stochastic.
Here You can use the best stock screener India for finding overbought and oversold stock
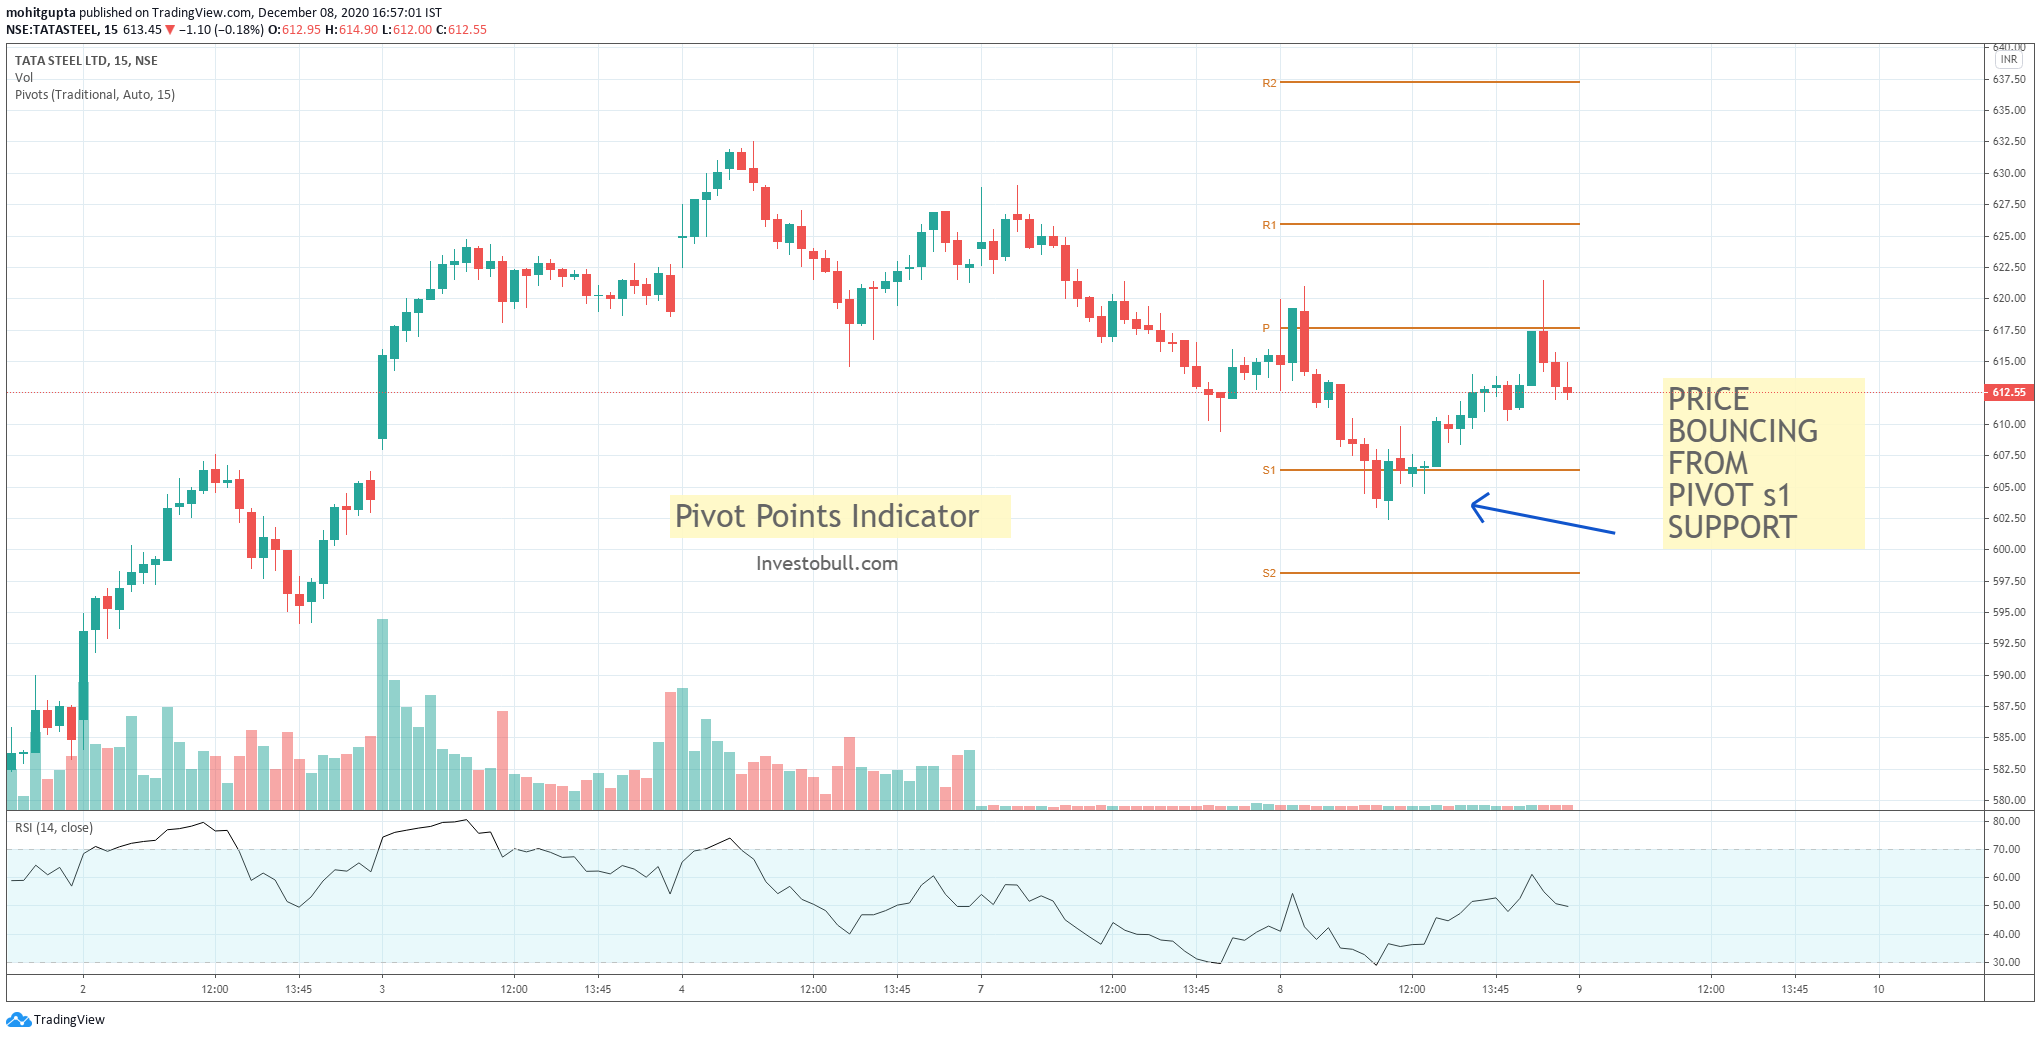
Pivot Points Indicator
Pivot points are one of the best indicator for intraday trading. It can be used in multiple timeframes. Pivot point indicator is used to calculate the daily, weekly, and monthly intervals. The pivot point is at the centre, and it can be calculated using the previous day high, low and close prices.This tool gives a specific plot of six support and resistance levels.
Pivot Point = [Previous day High + Previous day Low + Previous day Close] / 3
The three support levels are named as support 1(S1), support 2(S2), and support 3 (S3) and the three resistance levels are named as resistance 1 (R1), resistance 2(R2), and resistance 3 (R3).
Types of Pivot Points
There are various types of pivot points before you start using the indicator. Here is the list
- Standard Pivot Point
- Fibonacci Pivot Points
- DeMark Pivot Points
- Camarilla Pivot Point
- Woodie’s Pivot Point

How to use Pivot Points Indicator
- It is used to find the market trend in different time frames
- It is used to find support and resistance levels.
- Pivot Point support indicated to buy the shares and pivot point resistance is indicated to sell the shares
- Pivot points are used to define the entry, exit, stop and profit-taking levels.
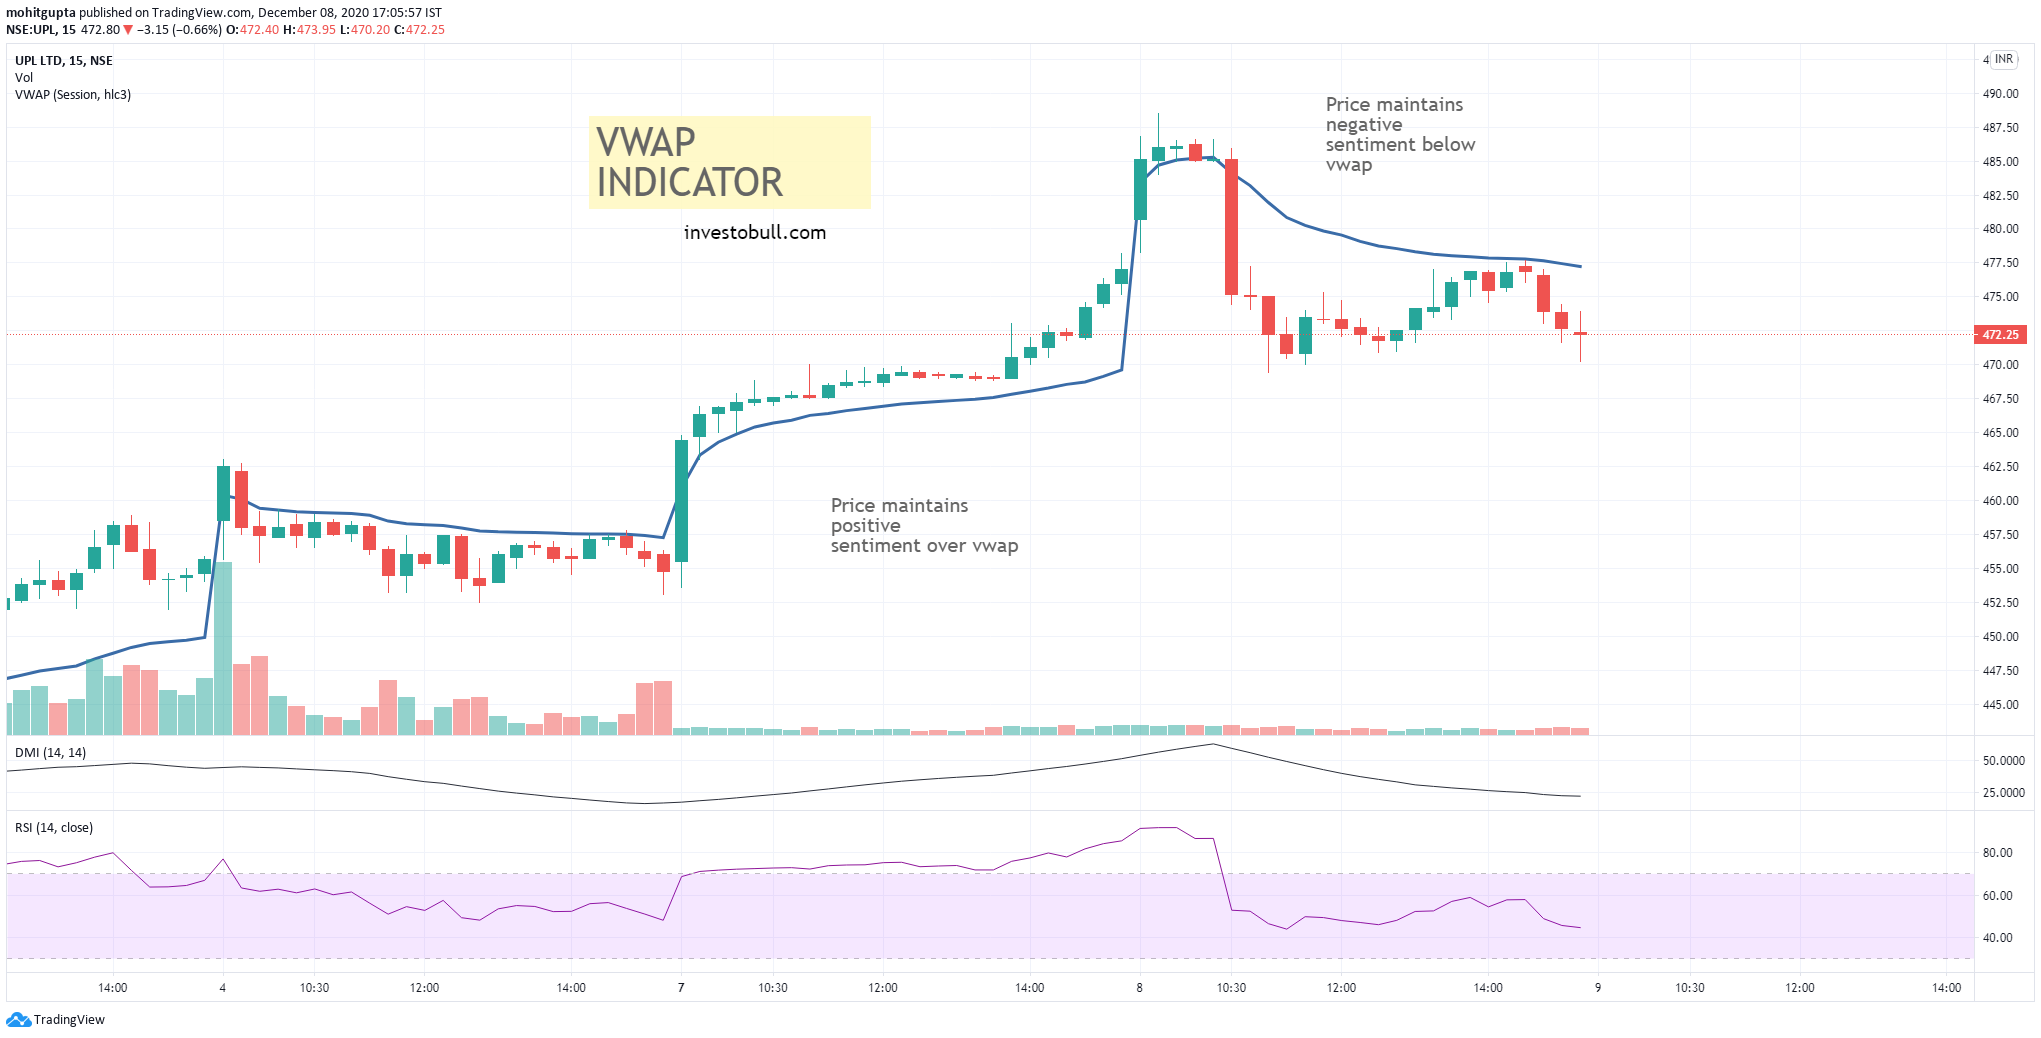
VWAP Indicator
The full form of VWAP is Volume weighted average price. It is the same as the moving average indicator, but additionally, VWAP considers the volume data in their calculation. VWAP is only for intraday traders. It cannot be viewed in the daily, weekly and monthly charts. If the price is above VWAP, it is an expensive stock and in the same way, if the price is below the VWAP, then it is a cheap share. VWAP indicators will not work on currency and forex because many software platforms don’t have volume data.
VWAP is calculated through the following steps:
1. For every period, determine the typical price,
typical price = H+L+C/3 and one candlestick is equal to one period. Fix the period according to the traders choice.
2. Multiply Typical price with volume and divide with cumulative volume
VWAP Formula
VWAP = Typical price * Volume/Cumulative Volume
How to use VWAP Indicator
- If the share price is above VWAP, it demotes bullish movement
- If the share price is below VWAP, it denotes Bearish movement
- VWAP act as a support and resistance according to the market Trend
- It indicates the uptrend when the share price breakout the VWAP line.
Bollinger Bands
Bollinger band is one of the best intraday trading indicators. Bollinger Bands are based on the moving average, and these are used to find the current market volatility. Bollinger Bands consists of three lines.
- The middle line is named as move average
- Upper line and Lower lines are named as standard deviations
As the upper line and lower line tells about the market volatility if the Bollinger band stretches then volatility increases and in the same way if the Bollinger band contracts when volatility decreases.
How to use Bollinger Bands
- The Bollinger Bands indicator is used to recognise whether the market position is “cheap” or “expensive.”
- If the Bollinger Bands squeeze, it indicates the market is going to breakout.
- Bollinger bands are used to know the high possibility of reversal trades.
- It is used to predict market movement.
Recommended Brokers
 | No 1 STOCKBROKER IN INDIA Zerodha Free equity & mutual fund investments | Flat ₹20 intraday and F&O trades | Rating ★★★★★ | APPLY NOW |
 | GET FREE DEMAT ACCOUNT Upstox Fix brokerage of Rs. 20 per trade | Rating ★★★★ | APPLY NOW |
 | GET FREE DEMAT ACCOUNT Angel Broking 0 Brokerage on Equity Delivery | Rs 20 per order for Intraday and F&O trades | Rating ★★★★★ | APPLY NOW |