
Traders use double top and double bottom chart patterns to recognize the possible trading signals. They represent a reversal from the current trend. In technical analysis, these are the best indicators.
Also read : Introduction to Chart Patterns
Double top patterns help traders to buy the shares at a low price, whereas double bottom patterns will produce better profits as the share price is moving upwards.

Table of Contents
What is Double Top Chart pattern?
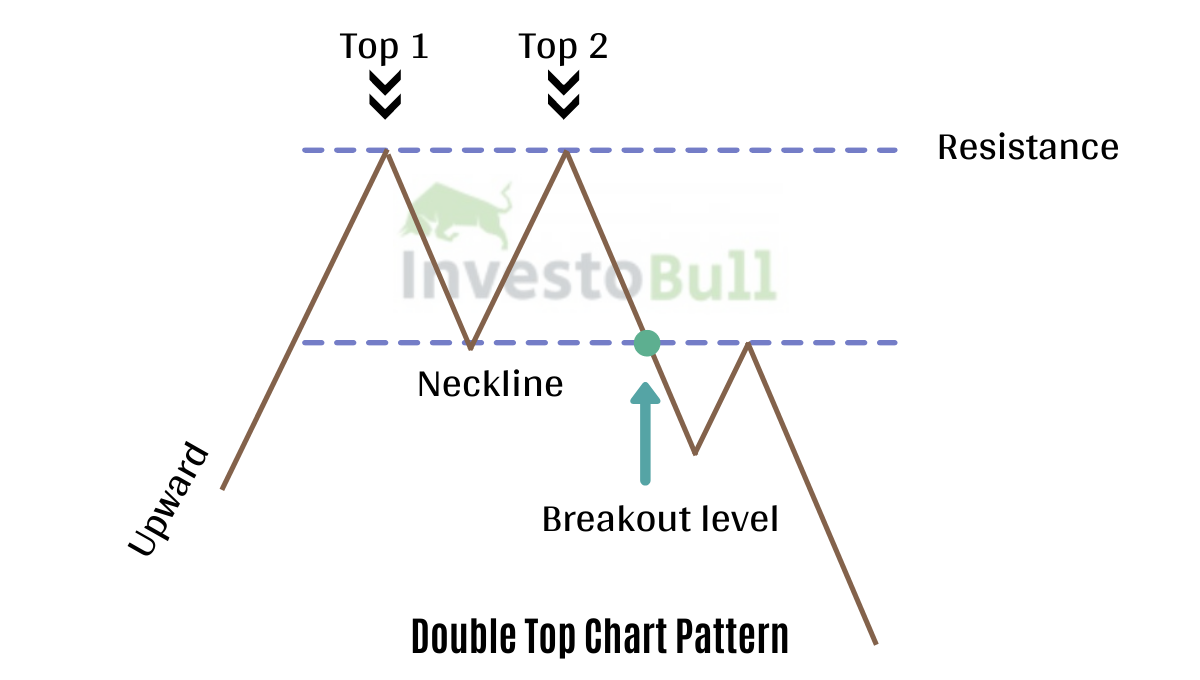
A double top reversal chart pattern and it pattern appears when the share price increases to a particular level. After reaching this level, the share price will start moving downwards and rise again to the same height or slightly vary to test the level again. If once the share price bounces back again, then we can consider double top is formed. The pattern looks like M shape and indicates a bearish market.
One of the most beneficial characters of a double top indicator is that inexperienced traders can also recognize it.
If the efficient double top has breakout the neckline after the two tops have reached, and finally, the share price will start moving downwards.
Notice that the share price breakout from the neckline is almost the same height as the distance from the neckline to double top formation.
What is Double Bottom chart pattern?
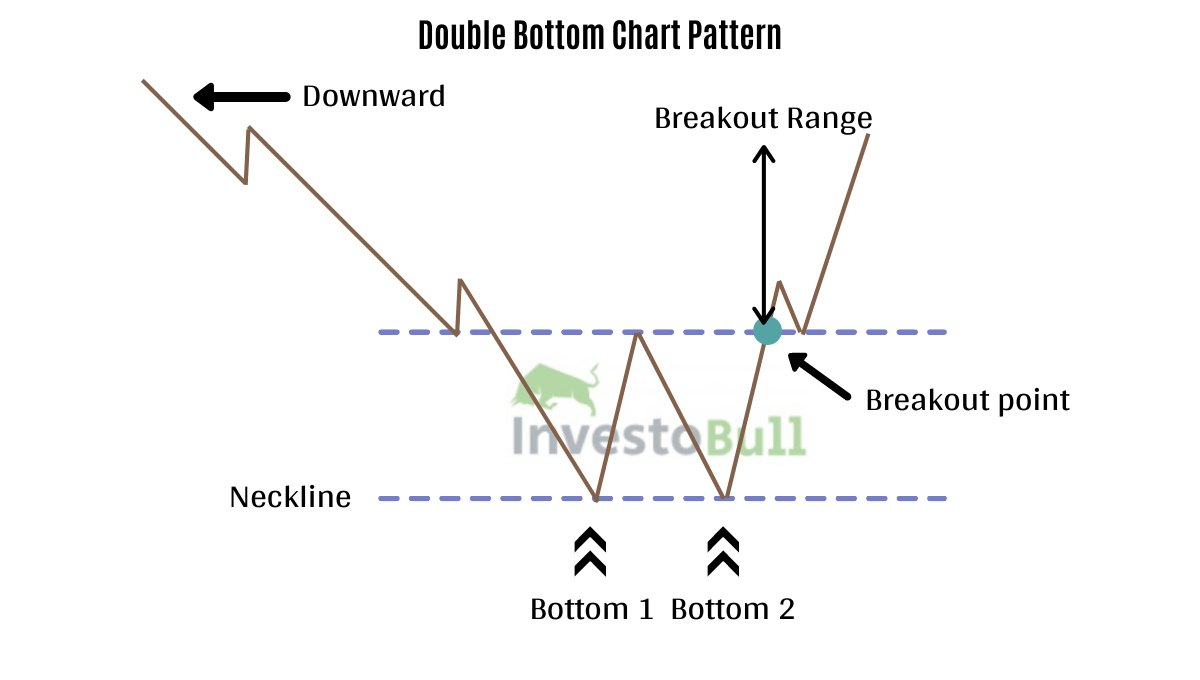
A double bottom reversal pattern appears when the share price decreases to a particular level. After reaching this level, the share price will start moving upwards and decrease again to the same height or slightly vary to test the level again. If once the share price bounces back again, then we can consider a double bottom is formed. The pattern looks like W shape and indicates a bullish market.
Many traders are interested in entering a long position at the share price of the second low. We can expect the bullish trend in the market.
Notice that the share price breakout from the neckline is almost the same height as the distance from the neckline to double bottom formation.
What do double tops and double bottoms indicate traders?
A double top or double bottom chart pattern can determine the potential trend reversal for the trader. However, the price reversal is not confirmed in both situations until the current trend has reached the second low level.
When compared to other technical indicators, double top and double bottom are better performing trend indicators. Because of it, most traders use this chart pattern to confirm the market trend before taking a position.
Both the double top and double bottom patterns are used to identify the trading signals and the positions created by using these indicators are mainly depending on the traders.

How to trade a Double Top Pattern?
A double top is a bearish indicator, which indicates a strong decrease in the share price. To make a profit in a double top pattern, the trader should sell the shares at a high price and purchase them in the future at a low price.
A simple way to trade a Double Top pattern is to recognize its neckline. If the share price breaks the neckline, traders can take a short position. A stop-loss must be placed over the two points. If the pattern fails, the loss will be less because we have already given stop loss. To determine the profit target, traders should find the distance between the neckline and two top points and place the line under the neckline.
How to trade a Double Bottom Pattern?
A double top is a bullish indicator, which indicates a rise in the share price. To make a profit in a double bottom pattern, the trader should take the position when the share price breaks the neckline and sell the position when the share is bouncing back.
Here traders will take advantage because of an increase in the share price at this position. You should set a stop loss at the maximum price to avoid losses when the share price is bouncing back.
How to identify a double top pattern
- Recognize the two tops width and height.
- Distance between tops will not be tiny
- Confirm neckline price level
- Use moving averages indicators to support double top bearish signals.
How to identify a double bottom pattern
- Recognize the two bottoms width and height
- Distance between bottoms will not be too small
- Confirm neckline price level
- Use moving averages indicators to support double bottom bullish signals.
- Be careful of trading with strong inverse trends.
Recommended Brokers
 | No 1 STOCKBROKER IN INDIA Zerodha Free equity & mutual fund investments | Flat ₹20 intraday and F&O trades | Rating ★★★★★ | APPLY NOW |
 | GET FREE DEMAT ACCOUNT Upstox Fix brokerage of Rs. 20 per trade | Rating ★★★★ | APPLY NOW |
 | GET FREE DEMAT ACCOUNT Angel Broking 0 Brokerage on Equity Delivery | Rs 20 per order for Intraday and F&O trades | Rating ★★★★★ | APPLY NOW |