
Triangle chart patterns are a technical analysis tool used by traders to identify the future price movement. A triangle pattern is formed by drawing trend lines using a converging prices range. Triangle patterns are the similar to wedge patterns , and it can be a continuation or reversal chart pattern. Technical analysts or experienced traders observe the breakout of a pattern and tell whether the market is bullish or bearish.
In a triangle pattern, the movement of share price between consolidation period can be either higher lows or Lower high, and the triangle is formed by joining a support and resistance line.
There are three kinds of triangle patterns:
- Ascending Pattern – It is a bullish pattern.
- Descending Pattern – It is a Bearish Pattern
- Symmetrical Pattern – It can be bullish or bearish

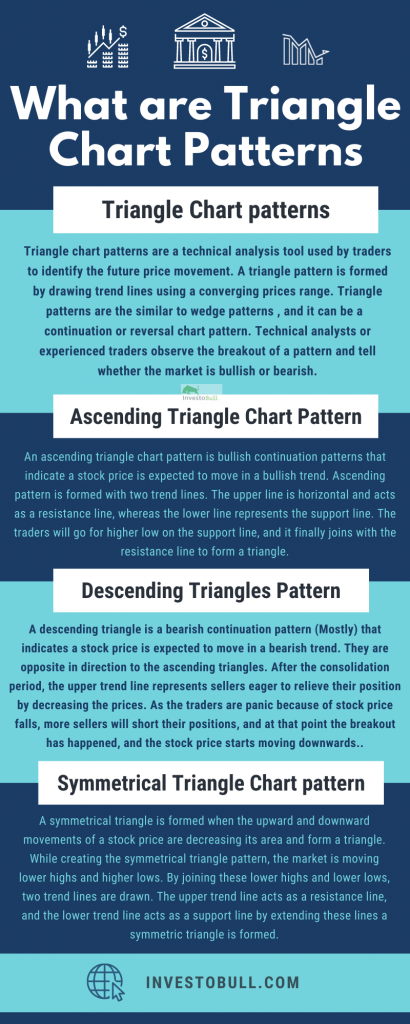
Table of Contents
What is the Ascending Triangle chart Pattern?
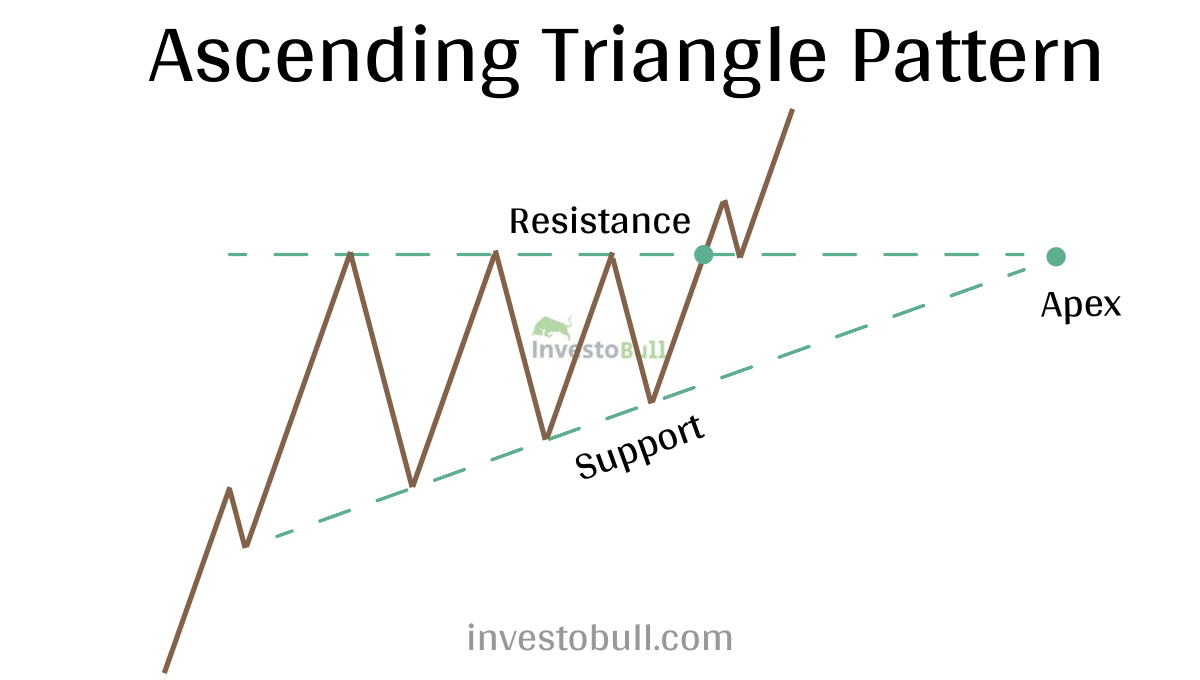
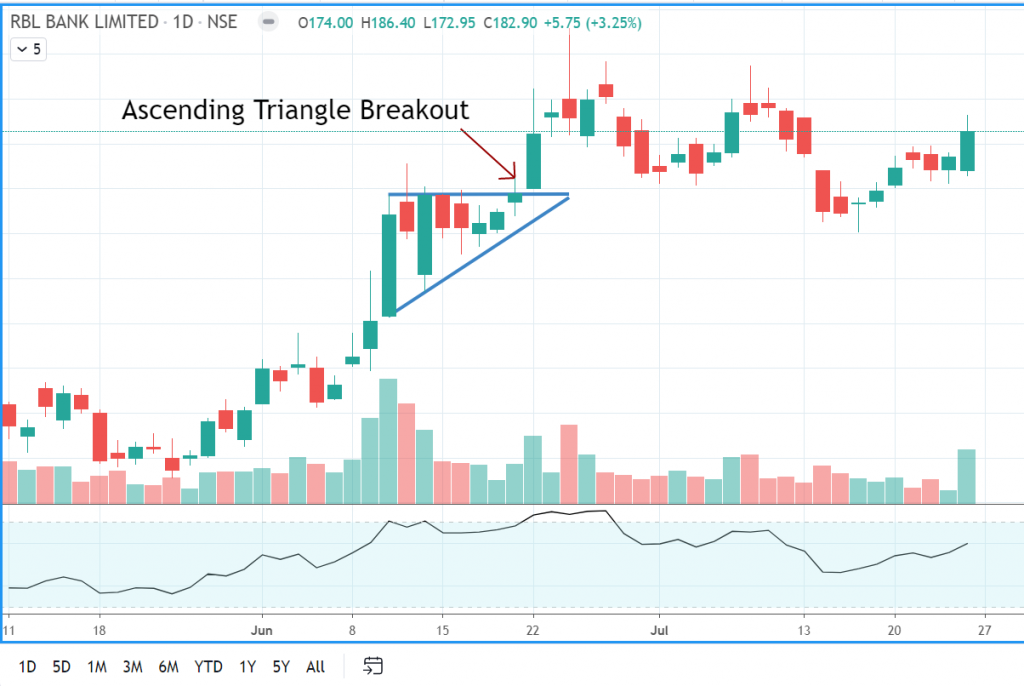
An ascending triangle chart pattern is bullish continuation patterns that indicate a stock price is expected to move in a bullish trend. Ascending pattern is formed with two trend lines. The upper line is horizontal and acts as a resistance line, whereas the lower line represents the support line. The traders will go for higher low on the support line, and it finally joins with the resistance line to form a triangle. The basic understanding is that the pattern shows that each time traders try to push prices lower. After the consolidation period, the price starts moving upwards, which is a breakout from the resistance line and moves upwards.
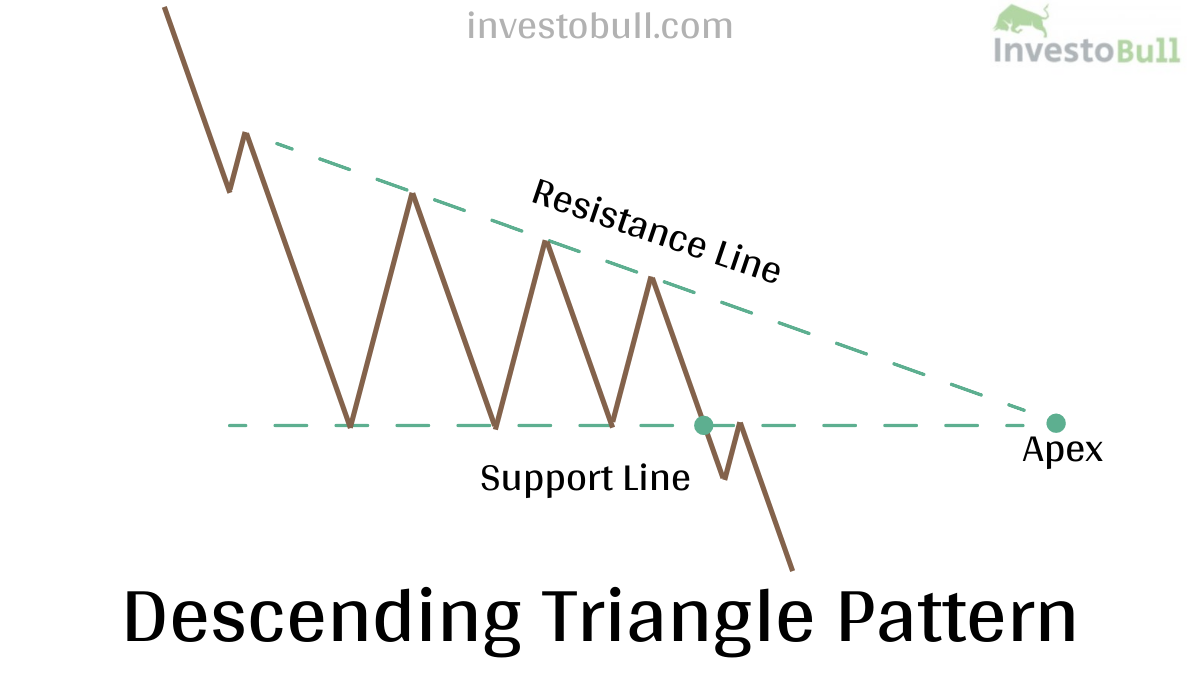
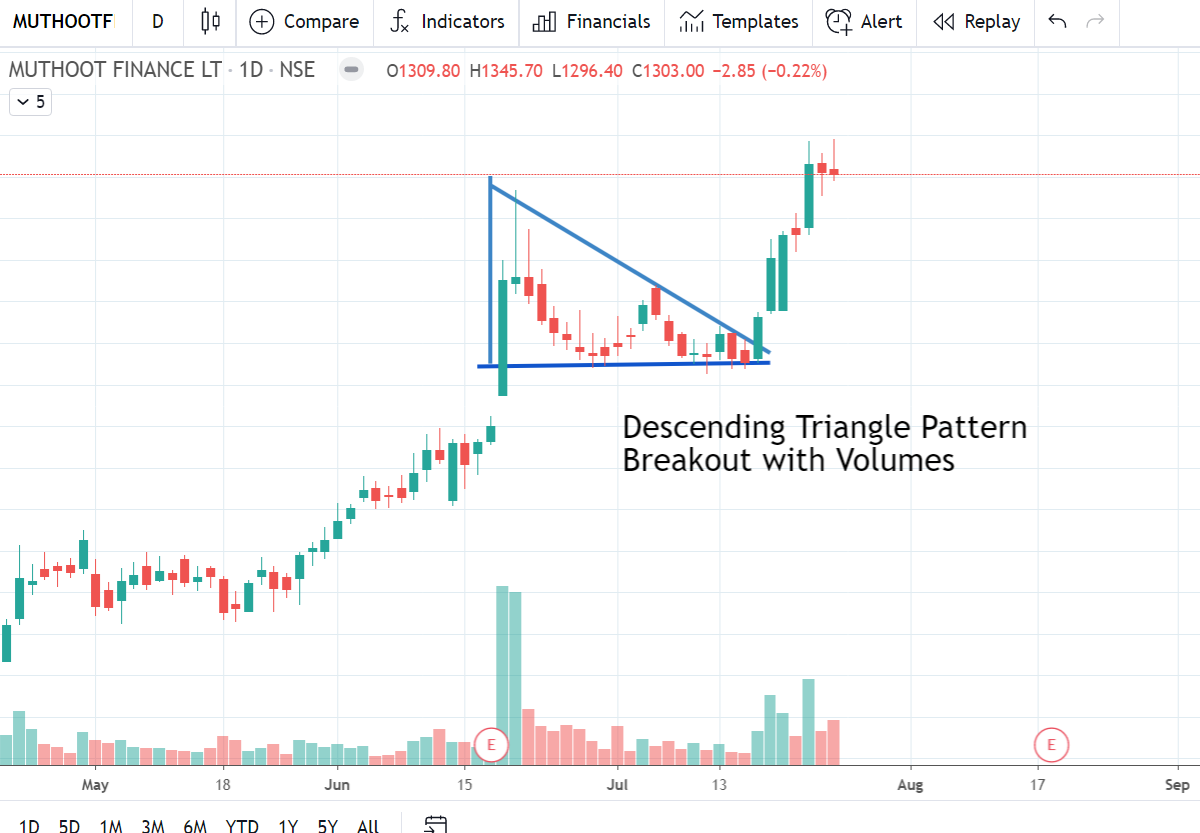
What is the Descending Triangles Pattern?
A descending triangle is a bearish continuation pattern (Mostly) that indicates a stock price is expected to move in a bearish trend. They are opposite in direction to the ascending triangles. Two trend lines form a Descending pattern. The lower line is horizontal and acts as a support line, whereas the upper line represents the resistance line. After the consolidation period, the upper trend line represents sellers eager to relieve their position by decreasing the prices. As the traders are panic because of stock price falls, more sellers will short their positions, and at that point the breakout has happened, and the stock price starts moving downwards. However there are also scenarios where descending triangle is formed after and up move and stock breaks out on upside to continue.
Consolidation Period – Here, the stock price is moving up and down. This basically depends on the trades(buying and selling positions).
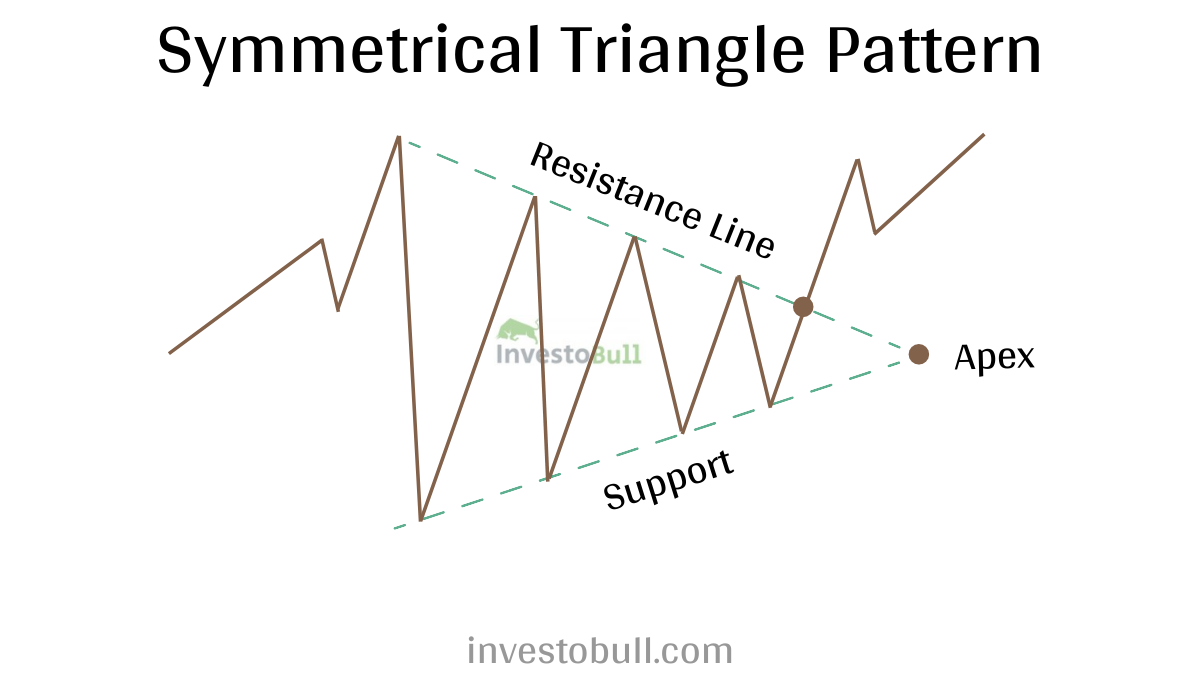
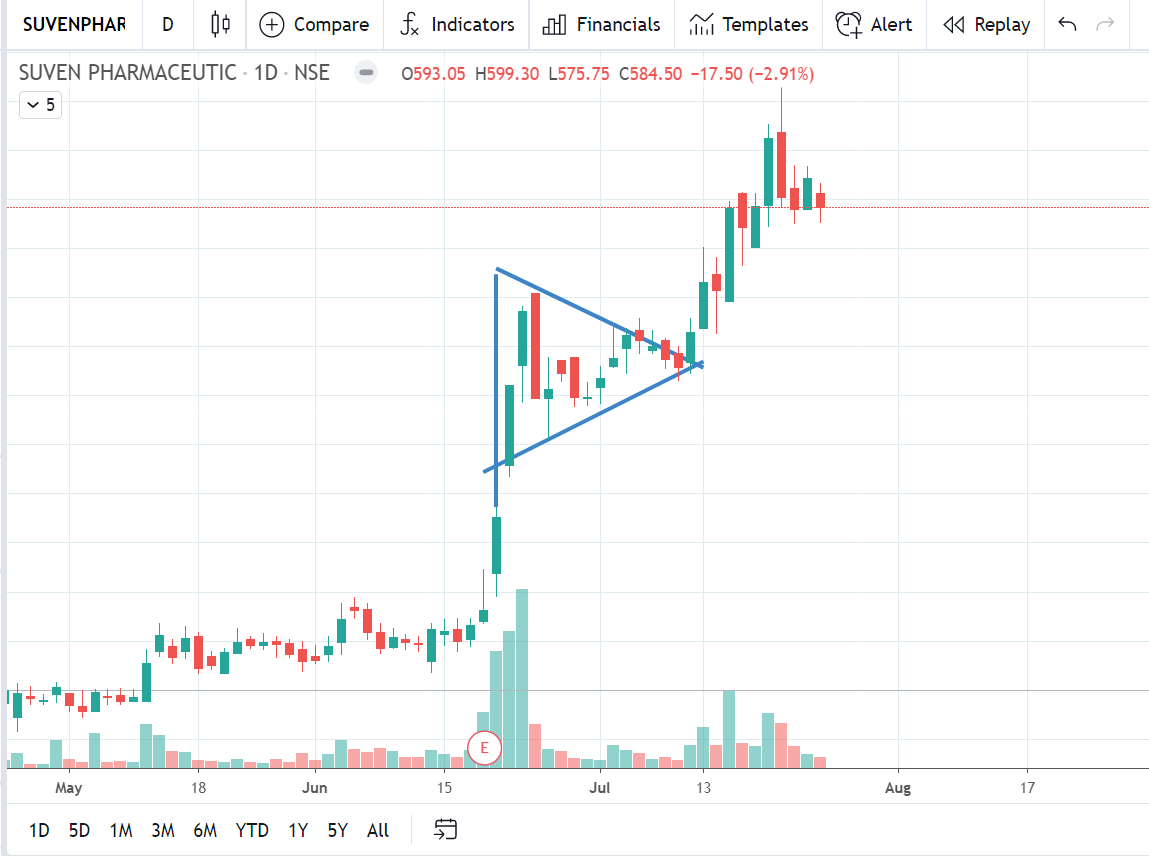
What is a symmetrical triangle pattern
A symmetrical triangle is formed when the upward and downward movements of a stock price are decreasing its area and form a triangle. While creating the symmetrical triangle pattern, the market is moving lower highs and higher lows. By joining these lower highs and lower lows, two trend lines are drawn. The upper trend line acts as a resistance line, and the lower trend line acts as a support line by extending these lines a symmetric triangle is formed. As the stock price is moving upward and downward in a triangle pattern various times, traders usually remain for the stock price to form three lower highs or higher lows. This indicates that both the buyers and the sellers are driving the stock price to obtain a clear trend.
Note – In a symmetrical triangle pattern the battle is between sellers and buyers.
Components of Triangle Chart Patterns
Top Horizontal Line:
At least two highs are needed to make the top horizontal line. The highs may not be accurate, but they must be near to each other. There must be some range between the highs, and low.
Lower Ascending Trend Line:
At least two lows are needed to make the lower ascending trend line. There must be some range between the low. If the previous low is less than or equal to the current low, then it is not a valid ascending triangle.
Duration:
The distance between the triangle pattern will range from weeks to months. These patterns are valid upto 1-3 months.
Volume:
As the pattern forms, volume usually declines. When the upside breakout happens, there will be an increase of volume after the breakout.
Return to Breakout:
In technical analysis, the support becomes resistance and resistance becomes support. When the horizontal support line of the descending triangle is broken, it becomes resistance, and when the horizontal resistance of the resistance line of the ascending triangle is broken, it becomes support. In both cases, the share price will reach support and resistance after breakout for retesting.
Target Price:
Once the breakout has happened, the target price prediction is determined by measuring the longest distance support and resistance lines, and it will be placed above the resistance line for ascending triangle and below the support line for descending triangle.

Key points to know before trading with triangle pattern
- Always be aware of the trend direction before the consolidation period.
- Use the resistance line and support line to recognize which triangle chart pattern is occurring.
- Find the distance between resistance and support line and place it according to the breakout level.
- Avoid all the false breakout, and it is always better to take the position after retesting the support or resistance line.

Recommended Brokers
 | No 1 STOCKBROKER IN INDIA Zerodha Free equity & mutual fund investments | Flat ₹20 intraday and F&O trades | Rating ★★★★★ | APPLY NOW |
 | GET FREE DEMAT ACCOUNT Upstox Fix brokerage of Rs. 20 per trade | Rating ★★★★ | APPLY NOW |
 | GET FREE DEMAT ACCOUNT Angel Broking 0 Brokerage on Equity Delivery | Rs 20 per order for Intraday and F&O trades | Rating ★★★★★ | APPLY NOW |