The Bullish Harami and Bearish Harami is two candlesticks pattern which indicates at a bullish reversal in the stock market.
Table of Contents
Bullish Harami Candlestick pattern
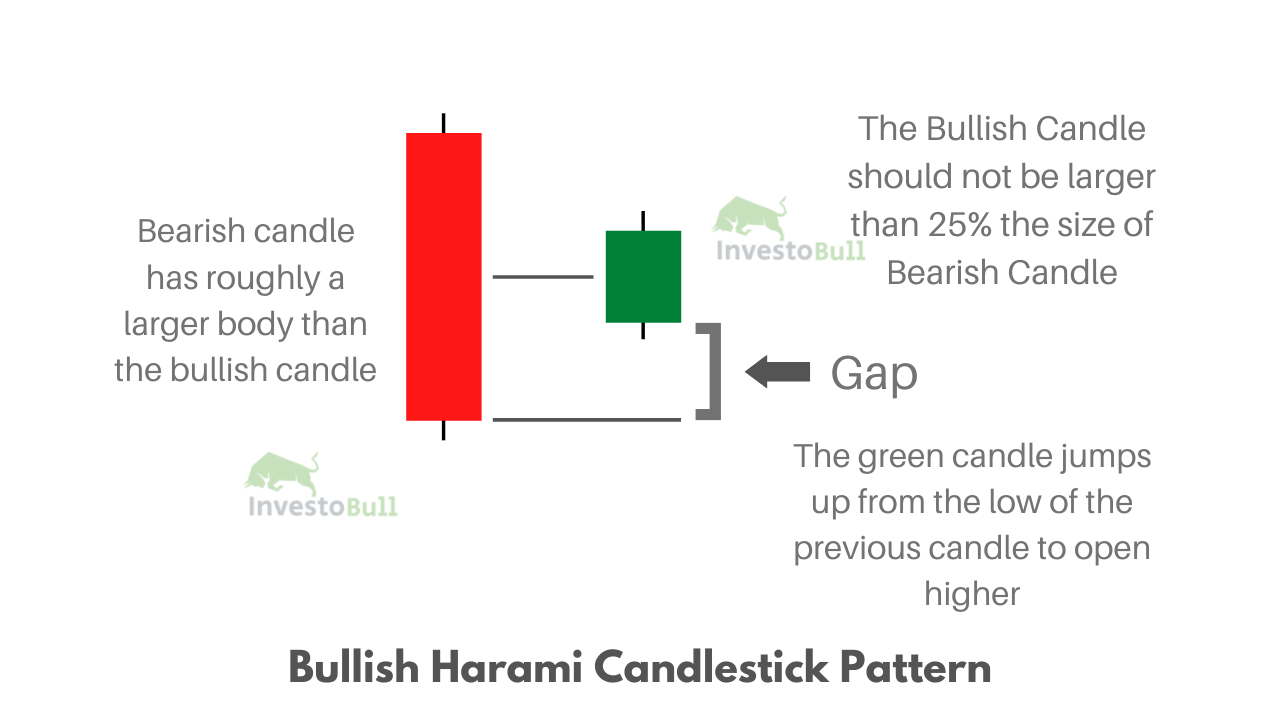
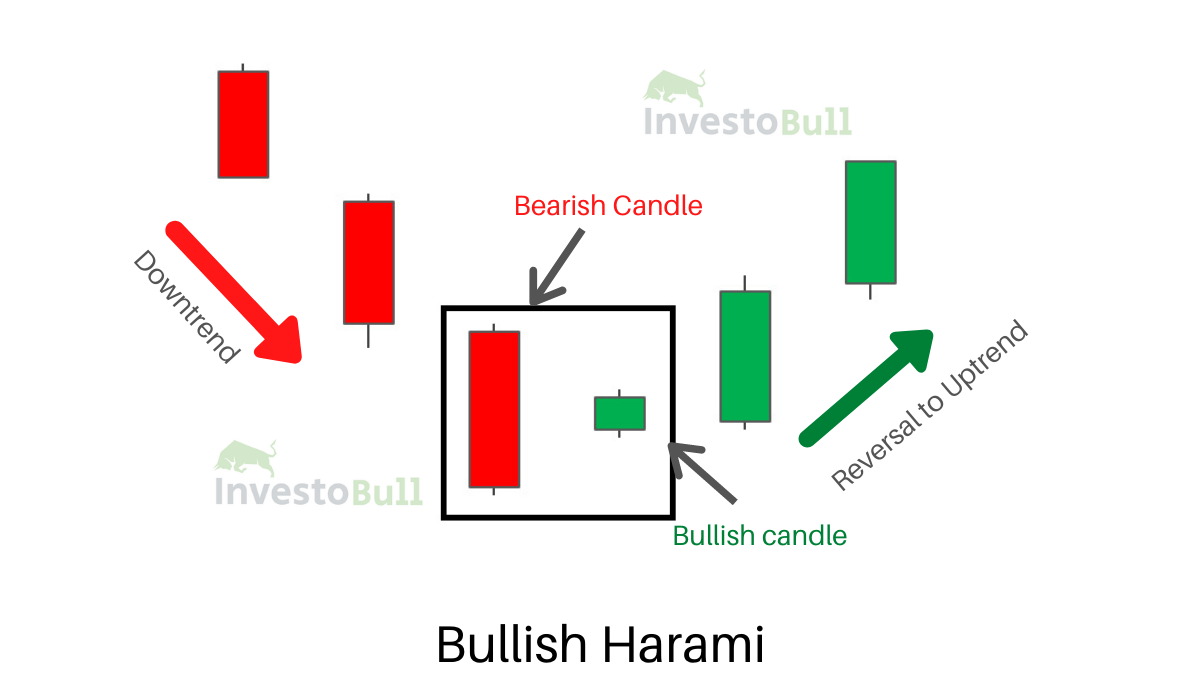
The Bullish Harami candle pattern is a reversal pattern looking at the bottom of a downtrend. It consists of a bearish candle with a large body and a bullish candle with a small body contained within the body of the previous candle. The small bullish candle ‘gaps’ up to open near the mid-range of the previous candle.
Related Post: Introduction to Candlestick Patterns
Identifying the Bullish Harami Candlestick Pattern
The Bullish Harami will look different on a stock chart compared to the 24- hour stock market, but the same tactics apply to identify the pattern.
- Firstly, you need to spot an existing downtrend in the chart.
- You need to look for signals that momentum is slowing/reversing.
- You need to ensure that the body of the small green candle measures not more than 25% of the previous bearish candle. Stocks will gap up displaying the green candle mid-way up the previous candle.
- You need to observe that the bullish candle is enclosed within the length of the previous bearish candle’s body.
Related Post: What is Dark Cloud Cover Candlestick Pattern
Trade using Bullish Harami Pattern
When a trader recognises a Bullish Harami pattern on a particular stock chart, you can enter into the trade in the next candle after Bullish Harami pattern emerges. The stop loss should be placed at the low of the previous candle.
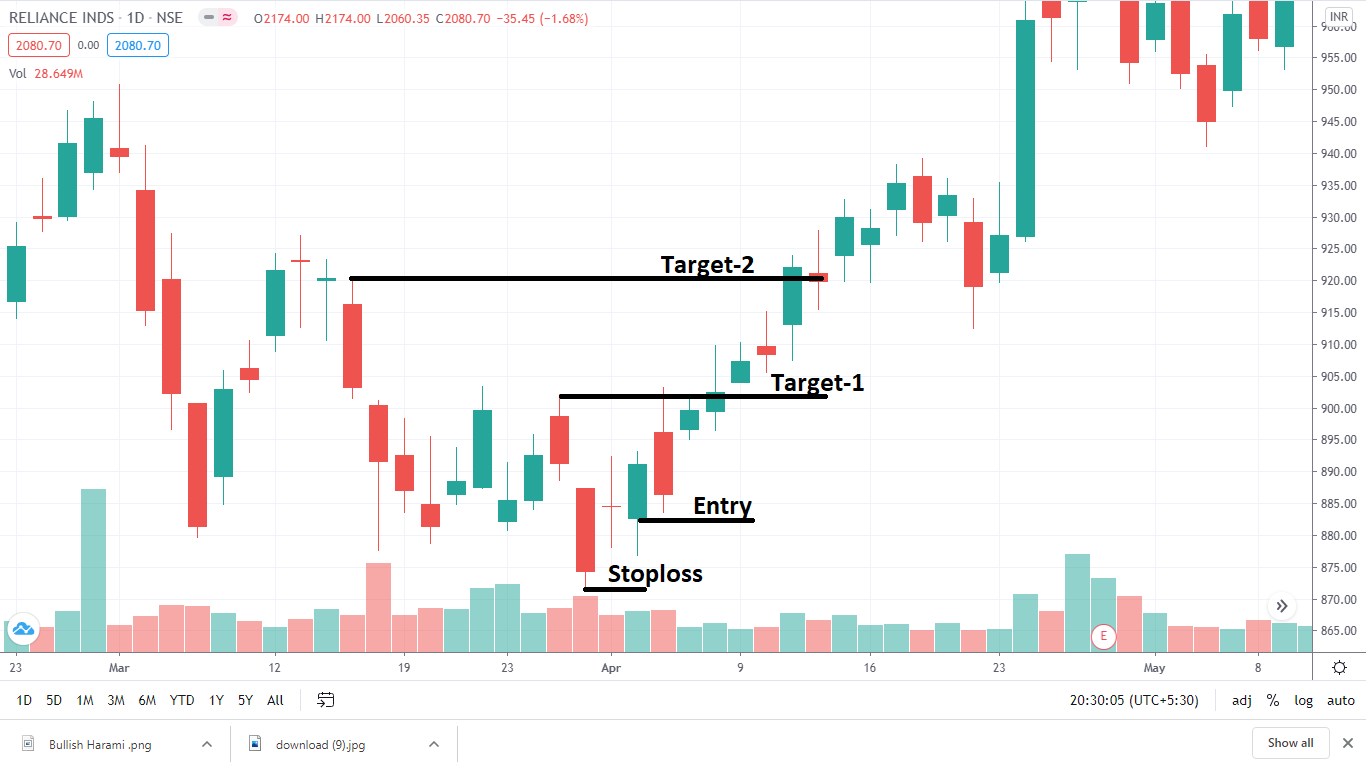
Bullish Harami Candlestick pattern is more reliable for day and swing traders. It is recommended to verify the signals given by this pattern by using other technical indicators as well.
The opposite of the Bullish Harami is the Bearish Harami and is found at the bottom of a downtrend.
Related Post: What is Doji Candlestick Pattern?
Bearish Harami Candlestick Pattern
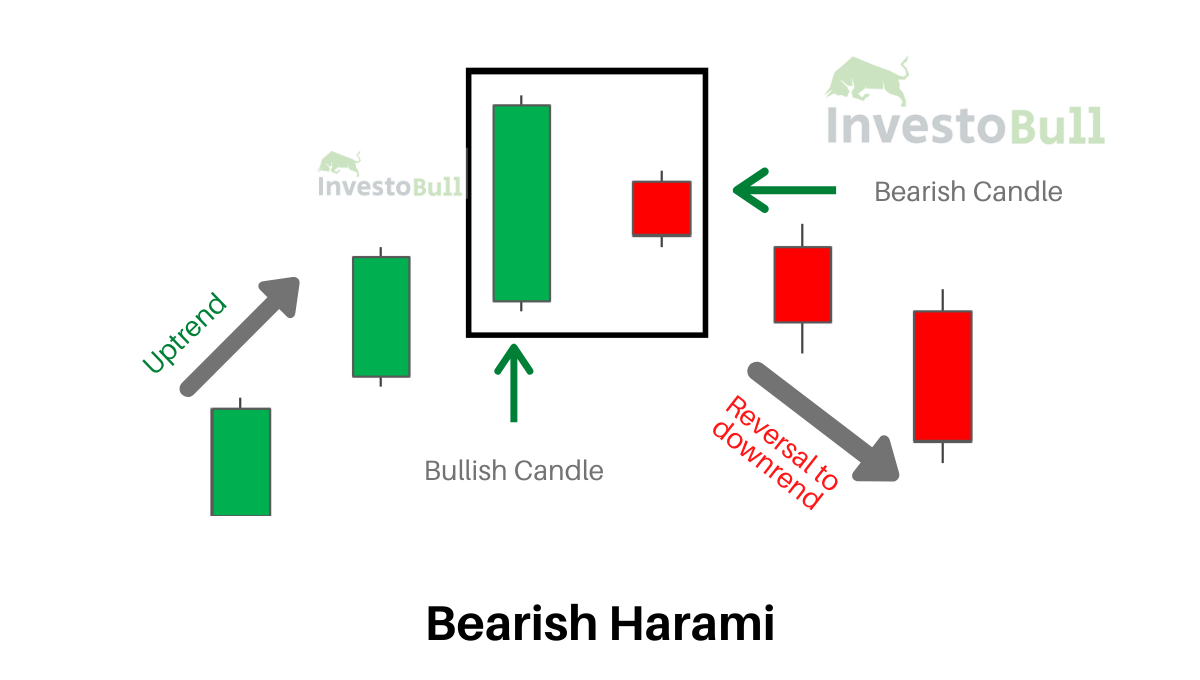
The Bearish Harami pattern is a reversal pattern emerging at the top of an uptrend. It consists of a bullish candle with a large body, followed by a bearish candle with a small body contained within the body of the previous candle.

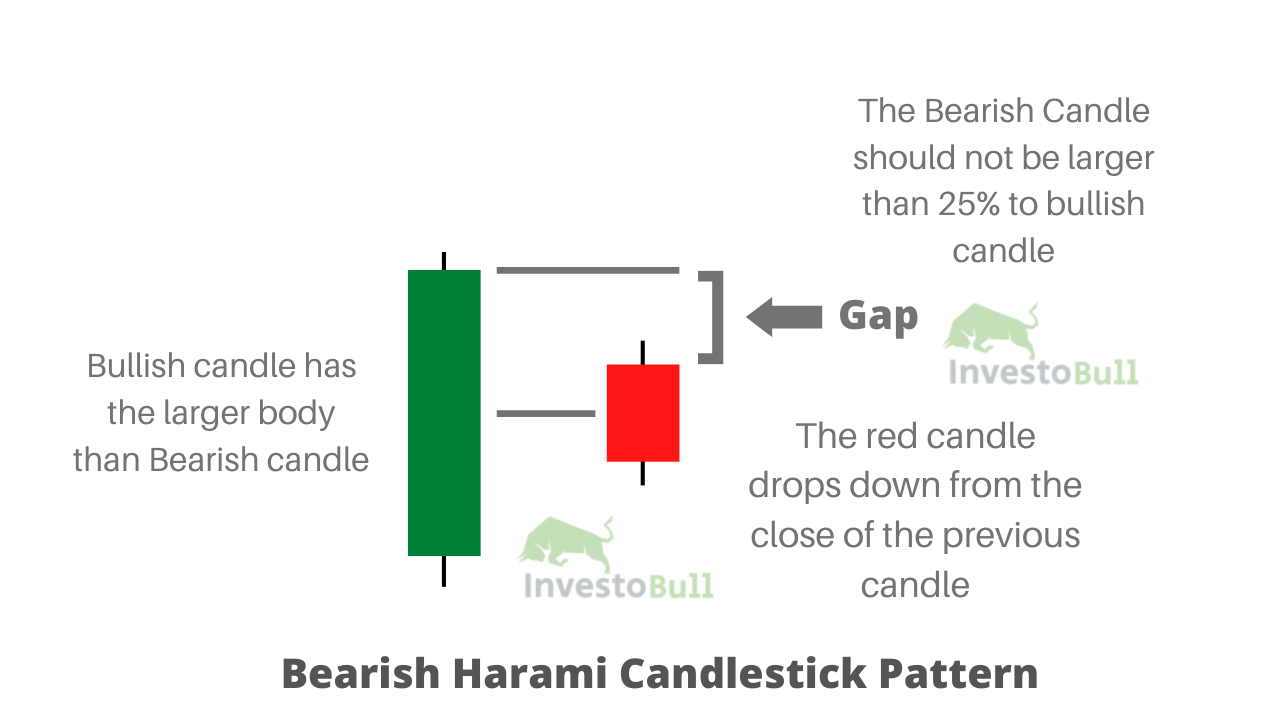
The small bearish candle ‘gaps’ down to open near the mid-range of the previous candle.
Related Post: Morning Star & Evening Star Candlestick Pattern
Identifying a Bearish Harami Candlestick Pattern
- To identify the bearish harami, you need to recognize an existing uptrend.
- You need to look for signals that prompt is slowing/reversing.
- You have to ensure that the body of the small red candle measures not larger than 25% of the previous bullish candle.
- Observe if the whole bearish candle is embedded within the length of the previous bullish candle’s body.
- Look for convergence with the use of supporting indicators, key levels of resistance.
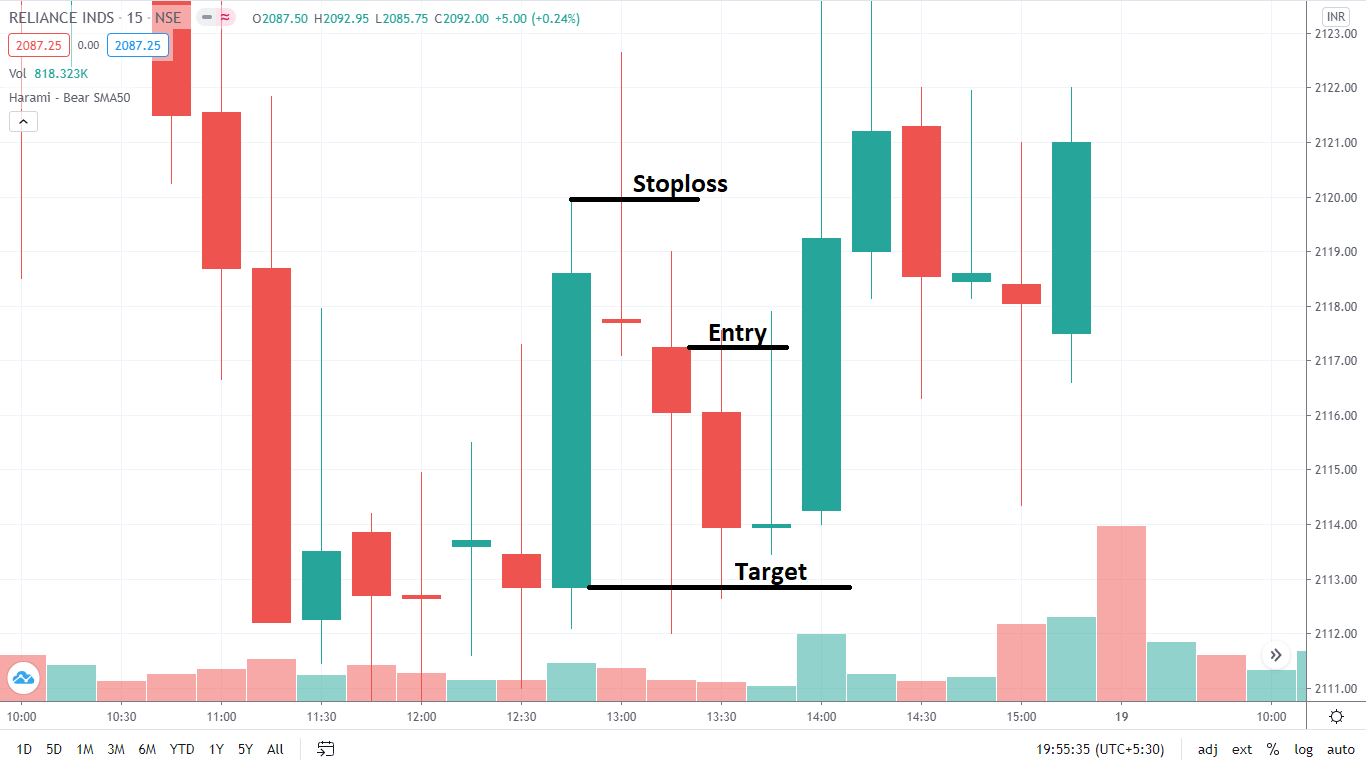
Trade using Bearish Harami Candlestick Pattern
When a trader recognises a Bearish Harami pattern on a particular stock chart, you can enter into the trade in the next candle after Bearish Harami pattern emerges. The stop loss should be placed at the high of the previous candle.
Advantages of Bullish Harami and Bearish Harami
- Entry levels as the pattern appear at the start of a possible uptrend.
- You can get a more risk to reward ratio when compared to the Bullish & Bearish Engulfing pattern.
- It is easy to identify for beginner traders.

FAQs
Recommended Brokers
 | No 1 STOCKBROKER IN INDIA Zerodha Free equity & mutual fund investments | Flat ₹20 intraday and F&O trades | Rating ★★★★★ | APPLY NOW |
 | GET FREE DEMAT ACCOUNT Upstox Fix brokerage of Rs. 20 per trade | Rating ★★★★ | APPLY NOW |
 | GET FREE DEMAT ACCOUNT Angel Broking 0 Brokerage on Equity Delivery | Rs 20 per order for Intraday and F&O trades | Rating ★★★★★ | APPLY NOW |