
The main components in technical analysis are chart patterns. Flag pattern is one of the chart patterns used by traders.Traders use these chart patterns for potential price movement in the market.
Usually, chart patterns can be categorized into two types based on their possible price movement.
- Continuation Chart Pattern
- Reversal Chart Pattern
Bullish and bearish flag patterns are famous chart patterns identified in technical analysis, which traders regularly use to recognize trend continuations.
A flag chart pattern is created when the market strengthens in a close range after a sharp movement. Flag patterns can be viewed in any time frame. In this article, we can discuss one high possibility continuation chart pattern known as the Flag pattern.

Table of Contents
Types of Flag Patterns
There are two kinds of Flag patterns based on their formation and potential. Both these patterns are opposite in formation. Let’s talk about each of them.
- Bullish Flag Pattern
- Bearish Flag Pattern
What is a Bullish Flag Pattern?
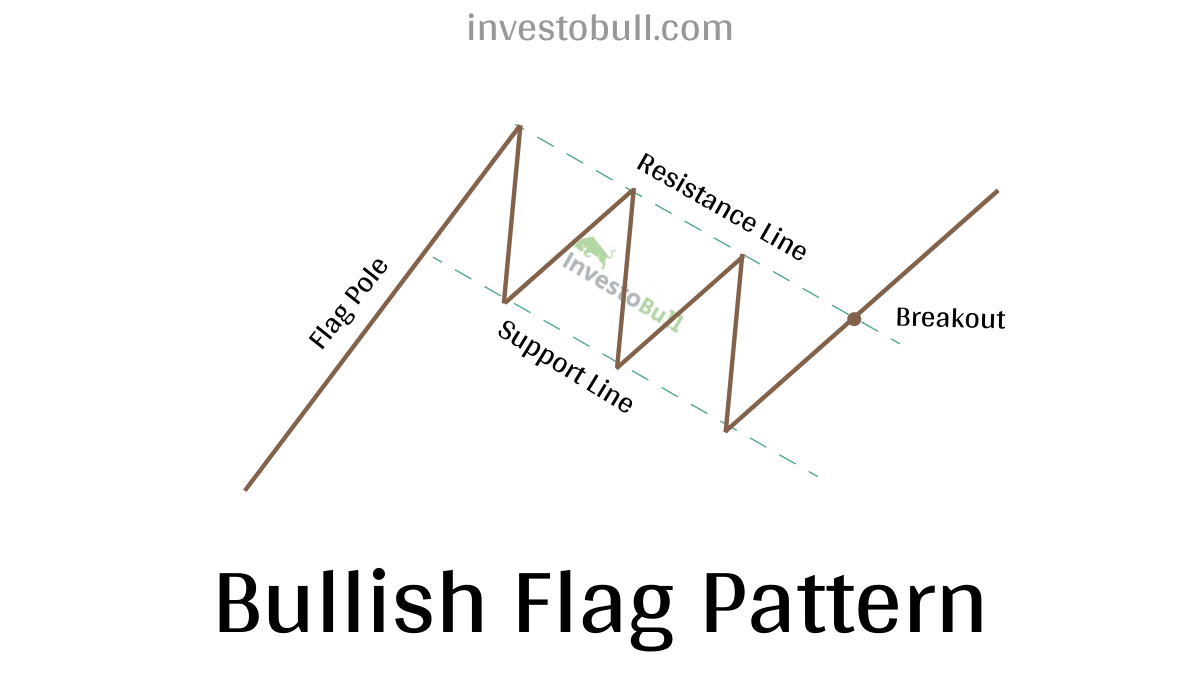
A bullish flag is a continuation pattern that is formed after a short pause in the trend, and more traders will take the position and then share price moves upwards. The bull flag pattern seems like a downsloping rectangle indicated by two identical trendlines. Here the upper line acts as resistance, and the lower line acts as support.
After the consolidation period, the Price breakout is formed in the resistance line, and again the price will bounce back to the resistance line for testing and start moving upwards. The sharp flagpole indicates how strong the bullish flag can be.
How to identify a bullish flag pattern
It isn’t easy to recognise a bullish flag pattern on a chart because it requires various elements. To trade this pattern, you need to identify and understand these components accurately. Here are the few things to consider before trading with the bullish flag pattern
- FInd Previous uptrend flag pole
- Find downward sloping consolidation
- If the bounce back is more than 60%, it is not a flag pattern. similarly, if the bounce backstops at less than 40%, it is the original trend
- Take position at the bottom of the flag pattern or above the resistance line.
- The pole height will your target price
What is a Bearish Flag Pattern?
The bearish flag is a continuation pattern that provides and downward trend. It is exactly opposite to the bullish flag pattern. The strong downward movement is known as a flag pole, and the consolidation channel is known as a flag.
The bearish flag pattern seems like an upward sloping rectangle indicated by two identical trendlines. Here the upper line acts as resistance, and the lower line acts as support.
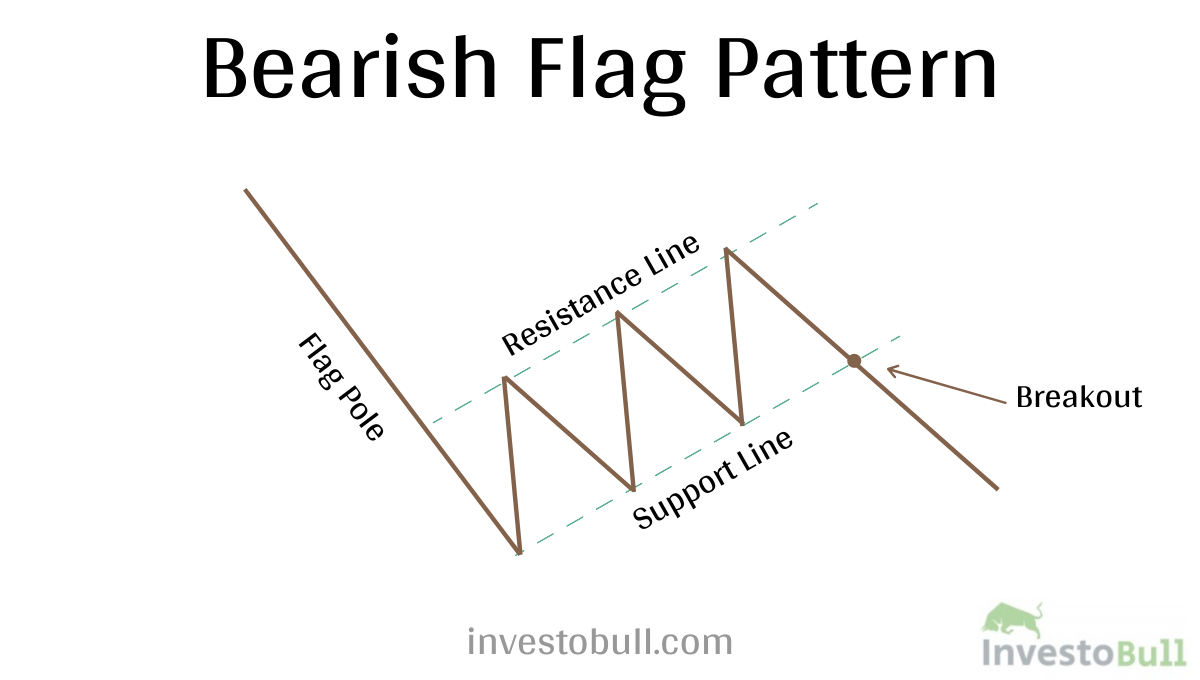
After the consolidation period, the Price breakout is formed in the support line, and again the price will bounce back to the support line for retesting and start moving downward. The sharp flagpole indicates how strong the bearish flag can be.
Note- Here flagpole are almost looking like vertical line, and it is moving downwards
How to identify the bearish flag pattern
It is easy to recognise a bearish flag pattern on a chart if you are aware of some elements. Bear flag patterns can be applied to all stock markets.
- Find previous downtrend flag pole
- Fin upward sloping consolidation
- If the bounce back is more than 50%, it is not a flag pattern. Similarly, if the bounce back is less than 38%, it is a downtrend.
- Take position at the top of the flag pattern or below the support line.
- The pole height will be your target price.
Requirements for a perfect Flag Pattern
- Pole formation should be vertical.
- The flag should be rectangular in shape.
- It should take less time to form.
- Positive flag pole needs to provide a positive break out, and the Negative flag pole needs to provide a negative breakout.
Components used in Flag Pattern
Sharp Move:
It is recognised as a continuation pattern, and there must be confirmation of a previous trend. Flags require proof of a sharp rise or drop on volume. These movements normally happen on heavy volume.
Flagpole:
The flagpole is the length from the resistance line to the high or low of the flag. The sharp increase or decrease that makes the flagpole will bounce back from the resistance or support line.
Flag:
A flag pattern is a rectangle in shape that slopes in downwards if the trend is bullish and vice versa. The price action can be done between the consolidation period.
Duration:
Flags patterns can be short-term that can last from 1 to 12weeks. Flag patterns can also depend on the timeframe. These patterns can be formed in less than one month. If the pattern is more than three months, we can consider it as an old pattern.
Break:
For a bearish flag pattern, the break out can happen below the support line, and for a bullish flag pattern the breakout can happen above the resistance line
Volume:
The volume will be high during the increase or decrease that create the flagpole. In a bullish pattern, if the price breakout the resistance line then more buyers will take position wheres in a bearish pattern, if the price breakout the support line, then more sellers will take a position.
Targets Price:
For the bullish flag pattern, the height of the flagpole can be placed above the resistance line for target price and for the bearish flag pattern the height of the flagpole can be placed below the support line for the target price.
Flag Potential Buy Signal
Traders will take buy positions when the price is above the resistance line. Here the price consolidated between support and resistance line and stop-loss is placed below the resistance line to reduce losses.
Flag Potential Sell Signal
Traders will take sell positions when the price is below the support line. Here the price consolidated between support and resistance line and stop-loss is placed below the support line to reduce losses.
Recommended Brokers
 | No 1 STOCKBROKER IN INDIA Zerodha Free equity & mutual fund investments | Flat ₹20 intraday and F&O trades | Rating ★★★★★ | APPLY NOW |
 | GET FREE DEMAT ACCOUNT Upstox Fix brokerage of Rs. 20 per trade | Rating ★★★★ | APPLY NOW |
 | GET FREE DEMAT ACCOUNT Angel Broking 0 Brokerage on Equity Delivery | Rs 20 per order for Intraday and F&O trades | Rating ★★★★★ | APPLY NOW |