
In this article we will understand in detail about the Free Cash Flow concept, how it is calculated and what are the key insights it provides about the status of the company.
Table of Contents
What is Free Cash Flow
Free cash flow of a company means how much cash a company is generating after doing all the expenses to run its business. So it is a true indicator of the profitability of a company. And profitability is what an investor looks in the company. So tracking Free Cash Flow should be the very thing done before investing in a company.
Free Cash Flow = Cash Flow from Operation(CFO) – Capex – Working Capital
CFO – the net income company generates from its operations every year.
Capex – is the money spent by the company for expansion or growth of the business like building manufacturing plants in new regions or increasing spend on R&D etc.
Working Capital – is the money required to run day to day operation of the company i.e. maintenance capex like maintenance of inventory, manufacturing plants etc.
Example How to Calculate FCF
Here we will understand how we can calculate FCF for a company from the income statements and balance sheet which are easily available.
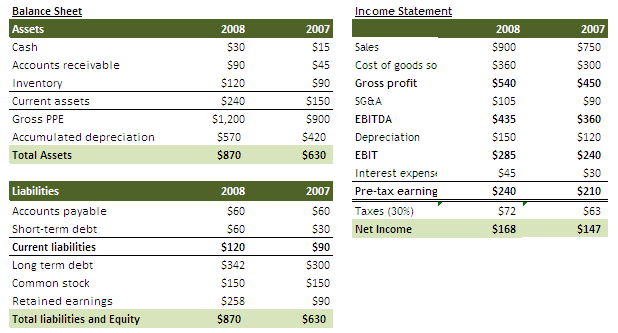
Here we will calculate the FCE for year 2008 step by step
1> Cash Flow from Operation – Cash flow from operation is available in cash flow statements. But it can be calculated from Balance Sheet and PNL Statement as well.
CFO = Net Income + Non-Cash Expense(Depriciation+AmortiZation)
Net Income = $168
Non-Cash Expense = Depreciation + Amortisation = $150 +$0 = $150
Here in the PNL statement Amortization is not present, so taken as 0
CFO = $168 + $150 = $318
2> Capex – Again Capex can be derived from Cash flow statements from the Investing Cash Flow component. But if you want to calculate from Balance Sheet and PNL, the formula for capex is
Capex = PPE current year – PPE last year + (Depreciation+Amortization)
PPE stands for Property, Plant and Equipment.
PPE current year = $1200 – $570 = $630
PPE last year = $900 – $420 = $480
Depreciation + Amortization = $150
Capex = $ 630 – $480 + $150 = $300
3> Change in Working Capital – This again can be calculated from balance sheet components of Accounts Receivable, Accounts Payable and Inventories. Formula of CWIP is
Change in Working Capital = (Accounts Receivable + Inventories – Accounts Payable) current year – (Accounts Receivable + Inventories – Accounts Payable) last year
Accounts Receivable in 2008 = $90
Inventories in 2008 = $120
Accounts Payable in 2008 = $60
Accounts Receivable in 2007 = $45
Inventories in 2007 = $90
Accounts Payable in 2007 = $60
Change in Working Capital = ($90 + $120 – $60) – ($45 + $90 – $60)
= $150 – $75 = $75
So applying the Formula for Free cash Flow, it comes as
Free Cash Flow = Cash Flow from Operations – Capex – Change in Working Capital
= $318 – $300 – $75
= -$57
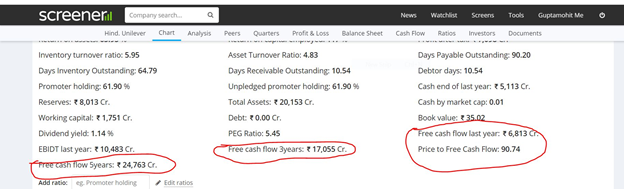
However you can get the Free cash flow data from site like Screener.in to get the data for free cash flow for different companies. Below is the snippet to demonstrate:
Why is Free Cash Flow important for Shareholders?
Free Cash Flow is very important for the shareholders because it is the surplus cash which the company is generating and it will then be distributed to its shareholders. It may not be directly distributed but then the extra cash will either be invested by the company for more growth or given to the investors in the form of dividend.
So if a company is showing positive free cash flow for a long period of time, say like 5 years, then it’s a must watch stock for analysis. Definitely further analysis of other factors are required to include it in the portfolio.
But it may happen that a good company can also show negative Free Cash Flow for some period if the company is aggressively growing and it may need to pump in capital for expansion to meet the increasing demands. Such investments on manufacturing plants or machineries or R&D improves the future earning potential of the company.
So If a company is showing negative Free cash flow for a few years and we see that the demand of the company’s product is increasing or the outstanding order book of the company is huge, then it’s not a bad investment. Because in this scenario the fund infusion or capex will affect the free cash flow for a short period but the future earnings potential will increase.
Manipulations done With Free Cash Flow
There are few manipulations that companies do with free cash flow. While investing , we should be aware of such types of manipulations so that we can skip shady companies.
- Companies with positive Free Cash Flow But Debt is still huge – Sometimes you may observe that the company is showing positive cash flow for a long period, but still it is having huge debt. This is not a good indication. It means the company is doing some manipulations like diverting the money to some other companies which is not good for investors. Or it is giving too much dividends to the shareholders which is also not favourable.
- Doing Some Manipulations with Accounts Receivables: Accounts receivables are the payments which company is expecting from their clients in future and so it increases the funds coming to the company. Sometimes company increases the accounts receivables thus projecting more cash available with the company for a short period. So it is important we look into the free cash flow data of a company for a continuous long period like 5 – 10 years.
Free Cash Flow V/S Net Cash Flow
Net Cash Flow = CFO – CFI – CFF
CFO = Cash Flow from Operation
CFI = Cash Flow from Investment
CFF = Cash Flow from Finance
- Cash flow from Operation as we already discussed is the cash generated from regular companies day to day operations .
- Cash flow from investment includes capital spent on acquisitions of companies or buying stakes in other companies or investments in mutual funds or fixed deposits etc.
- Cash flow from financing includes payment of interest on loans or repayment of loans or paying out dividend or buy back of shares.
Now the question is what is more relevant to analyse the company ? Is it Free Cash Flow or Net Cash Flow.
If you observe carefully, it is the Free Cash Flow which actually gives the better picture of the ability of the company to generate surplus cash from its operation. This Free cash is actually utilised to do activities like investments , acquisitions, or buy back of shares or paying out the dividends which come under CFI or CFF.
But in case of Net Cash Flow, it will not indicate the ability of the business to generate the cash as it deducts the amount spent on investments or paying dividends from the free cash available with the company. After all that deduction not much cash will be available with the company.
So Net Cash Flow can give erroneous pictures of companies not generating the cash as all that cash was consumed in investments or finances.
Key Points To Remember
- Free Cash Flow gives an idea how much surplus money a company generates every year from its business operations.
- Positive Free Cash Flow for long term indicates the health business position of the company.
- Simple way to calculate Free Cash Flow is subtracting capex and working capital from operating cash flow.
- Established companies normally have consistent positive cash flow than the new and growing companies.
- Free Cash flow is normally used to analyse non financial institutions where there is a clear requirement of capex like manufacturing units, plants, equipments and inventories.
Recommended Brokers
 | No 1 STOCKBROKER IN INDIA Zerodha Free equity & mutual fund investments | Flat ₹20 intraday and F&O trades | Rating ★★★★★ | APPLY NOW |
 | GET FREE DEMAT ACCOUNT Upstox Fix brokerage of Rs. 20 per trade | Rating ★★★★ | APPLY NOW |
 | GET FREE DEMAT ACCOUNT Angel Broking 0 Brokerage on Equity Delivery | Rs 20 per order for Intraday and F&O trades | Rating ★★★★★ | APPLY NOW |