India VIX is a volatility index computed by NSE and is based on out of the money Options of Nifty .In simple terms, India Vix represents how much traders expect Nifty to move in near term. A higher India Vix represents there is expectation of sharp move in Nifty in coming days . A low Vix represents traders expecting markets to be stable mostly. To understand India Vix better , we need to understand What is volatility Index, as India Vix is also a volatility index of Nifty .
Table of Contents
What is the Volatility Index?
Put in simple words, Volatility Index is a measure of the market‟s expectation of volatility over the near term. When there is a lot of uncertainty in markets(example corona epidemic crisis), the market moves steeply up or down and the volatility index tends to rise. As volatility subsides, the volatility index declines. Again remember volatility index is different from Nifty Index. Volatility Index is in percentage while Nifty index is computed using the price movement of the underlying 50 stocks in Nifty .
Volatility Index is computed using the order book of the underlying index options and is denoted as an annualised percentage.The concept of Volatility Index was first introduced by The Chicago Board of Options Exchange (CBOE) for the US markets in 1993 based on S&P 100 Index option prices. In 2003, the methodology was revised and the new volatility index was based on S&P 500 Index options. Since then , the volatility index has become an good indicator of how market participants think of Volatility in the near term.

What is India Vix and How is it interpreted – Fear Index
India Vix is a volatility index based on the NIFTY index and represents how much market participants are expecting NIFTY to move in the near term. Example recently india vix shot upto 60% when Nifty price was 10000 around. It means that traders are expecting Nifty to move by +60% or -60% in the coming 1 year and the probability of such movement is 68% (one standard deviation) . However India vix is mostly used for estimation of expected volatility in the near month. Means if Annual Volatility is expected to be high , monthly volatility will also be high .
Monthly Expected Volatility is Vix Value / Square root 12
Example an India Vix value of 60 means 60/3.46 = 17.3% which is monthly volatility
Vix is also called Fear gauge or Fear Index. India vix gives an indication of how much nervous traders or market investors are. When market participants are nervous on markets falling too much , they hedge positions or speculate by buying out of the money options. Now we know that when demand for something increases , its price increases. So the more the market participants are nervous , the more they want to buy out of the money options at higher premiums .Since Vix is calculated using out of money options premium , Vix also increases. Hence it’s also called the Fear index because it directly correlated to fear or nervousness in Markets.
Historical Range of VIX
In the below diagram, we see historical price of India Vix from may 2018 to
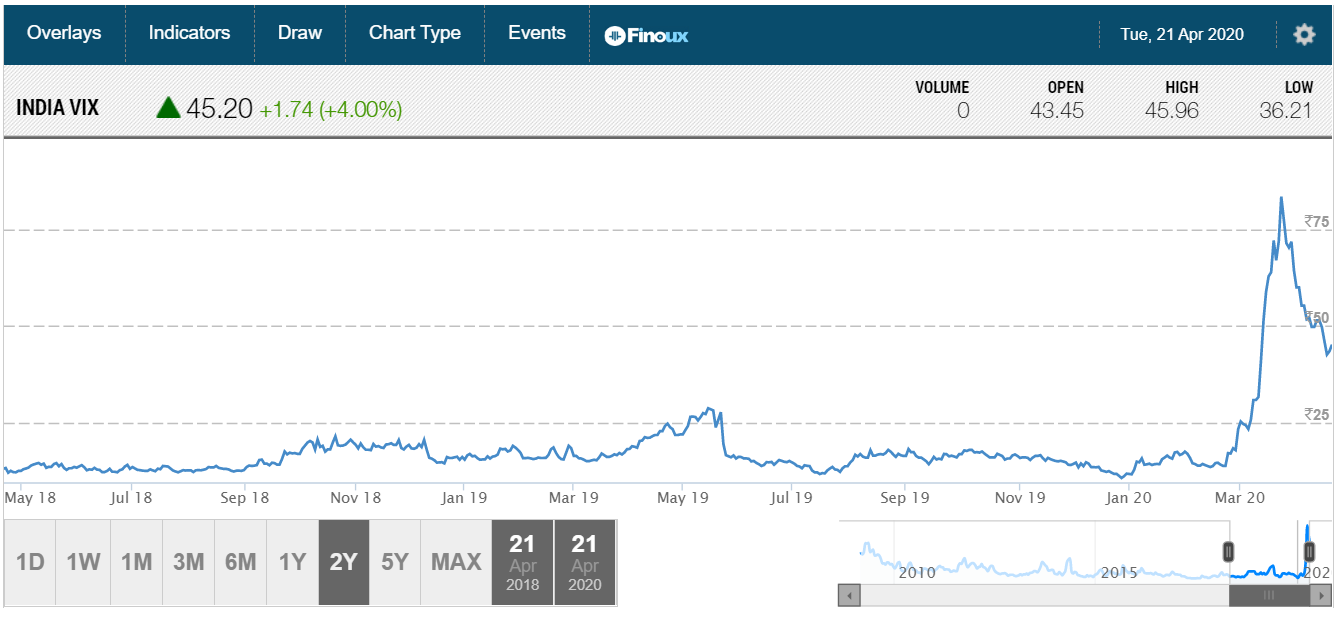
We see from past data that the Usual range of India Vix is in 10% to 20% . However we see that in March 2020 , India Vix shot upto 75% due to the coronavirus epidemic and a lot of nervousness and Fear . Hence Vix rose sharply. As markets calmed a bit , Vix fell to 45% in next 20 days.
How Does India Vix Tends to change with Nifty 50 Price movement
Usually it’s seen that when Nifty 50 falls, Vix tends to increase because people go and buy out of money (OTM) put options for protection . When Nifty50 remains flat or rises slowly , people are happy and they don’t see a need to buy out of money for protection. The Vix tends to decrease in this case. Also when Nifty 50 rises sharply , Vix tends to increase because participants may buy puts a bit to protect profits . Broadly speaking , when sharp movements are there in Nifty , Vix tends to increase as out of the money options premium increases. But when expectation of falling is more than vix increases more than expectation of rising.
How can you use VIX for Investing and trading ?
Since expected volatility impacts investors and traders both , Vix data can be used by traders and investors in many ways to protect portfolio or open positions.
Long term investors can shift from Sensitive sectors to defensive sectors if Vix tends to rise. Example if Vix is expected to rise and remain high , one may shift from high beta sectors like financials to defensive sectors like FMCG and Pharma.
India Vix can also be traded in futures in markets. So traders who expect volatility to increase can buy India Vix futures and traders who expect Volatility to go down can short india Vix futures.These trades are good trades when key news and announcements are due.
Vix indication gives you a trading range. When you take short positions and Vix rises, you expect more downside and carry shorts. If vix increases and remains high , you can continue shorts. If vix is decreasing , you sell OTM options to make money.
Vix can also give you near term market movement expectations which can impact your trading and hedging decisions.
When Vix is low , Option prices are low. Usually traders take net long premium strategies when vix is low. On the other hand , when vix is high , we know vix will return to normal in some time. So usually Net short premium strategies are taken in options.
You can check current value of VIX on moneycontrol website India Vix is also available on Nseindia website under indices section.

NIFTY Range based on VIX
As stated earlier, India Vix is basically nothing but expected annual volatility of Nifty Index. Now we can use this data to find of Monthly , Weekly and Daily expected range of Nifty based on Volatility. This can be done using IntradayScreener.com Nifty analysis tool.
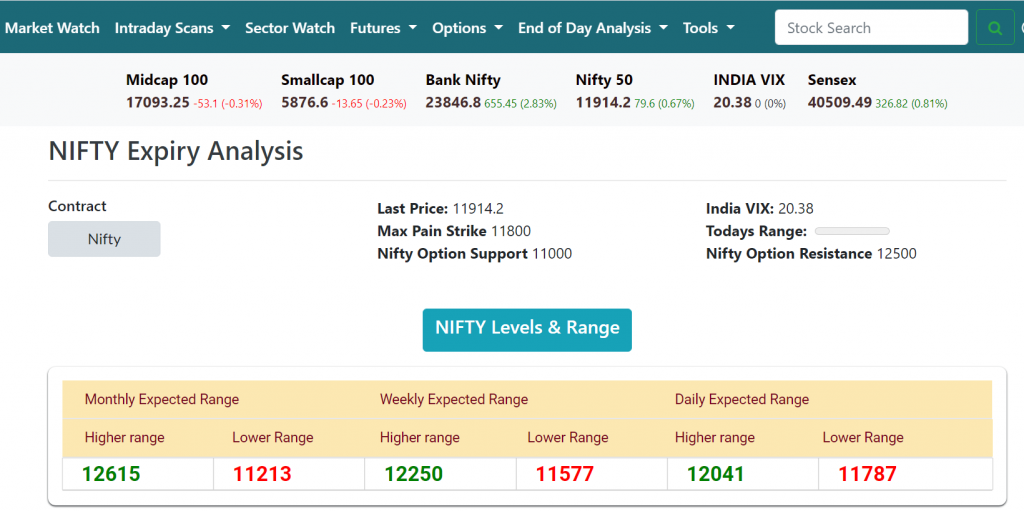
Using this data , you can sell Weekly and Monthly far out the money options which are above or below Nifty range.
Recommended Brokers
 | No 1 STOCKBROKER IN INDIA Zerodha Free equity & mutual fund investments | Flat ₹20 intraday and F&O trades | Rating ★★★★★ | APPLY NOW |
 | GET FREE DEMAT ACCOUNT Upstox Fix brokerage of Rs. 20 per trade | Rating ★★★★ | APPLY NOW |
 | GET FREE DEMAT ACCOUNT Angel Broking 0 Brokerage on Equity Delivery | Rs 20 per order for Intraday and F&O trades | Rating ★★★★★ | APPLY NOW |