Table of Contents
What is ADX indicator?
ADX stands for Average Directional Movement Index and can be used to measure the strength and ability of a trend. The ADX indicator is determined as an average of expanding price range values. The ADX Indicator is a component of the Directional Movement System developed by Welles Wilder.
The ADX indicator is a combination of two other indicators developed by Wilder, the positive directional indicator (abbreviated +DI) and negative directional indicator (-DI).The ADX combines them and smooths the result with a smoothed moving average.
This system attempts to measure the strength of price movement in the bullish market and the bearish market using the +DMI and -DMI indicators along with the ADX
It works in both trending and range-bound market. Here is an image of how an ADX indicator looks. One of the most accurate indicators used in trading to book more profits is ADX or Average Directional Index.
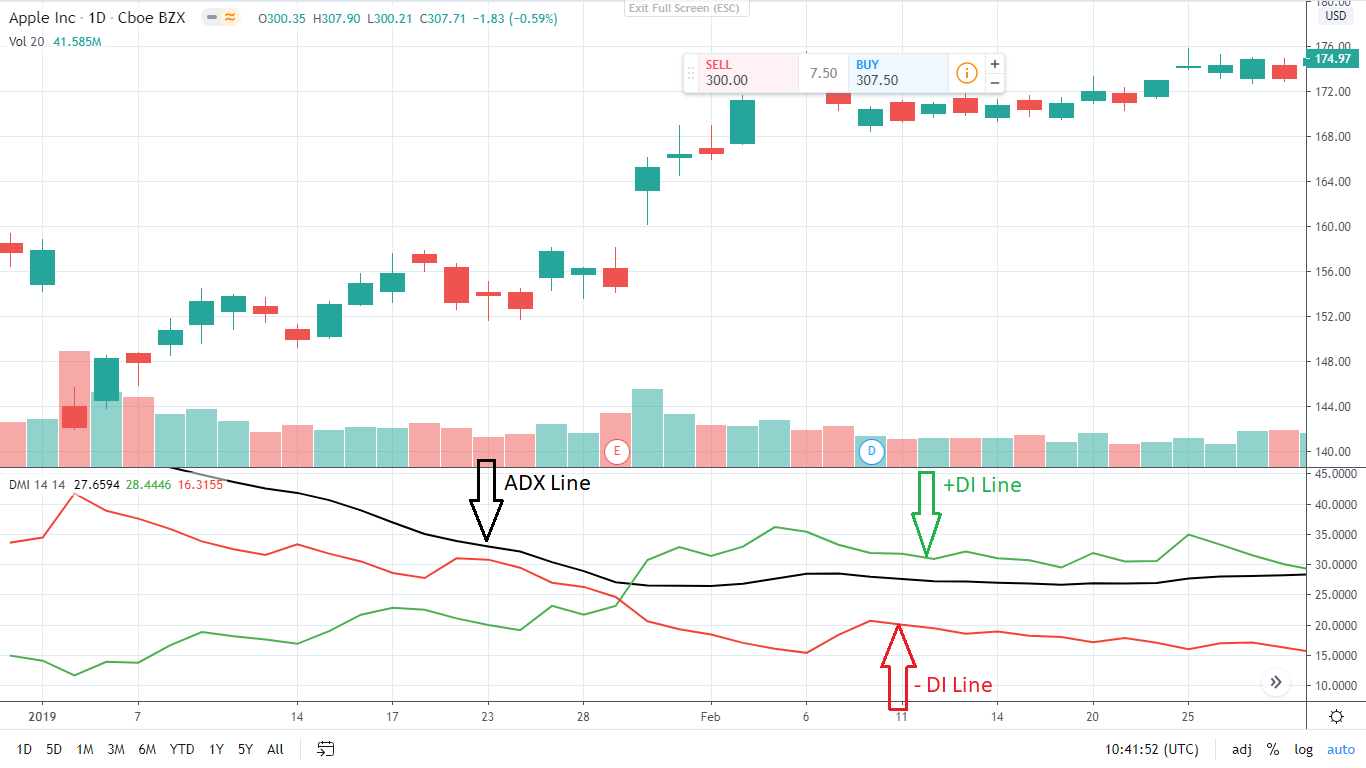
In the ADX indicator, there are three main lines as shown in the above image. which are
- ADX Line: ADX line is in Deep Sky Blue & Black in colour.
- +DI Line: Positive Direction movement line is in Green in colour.
- -DI Line: Negative Direction movement line is in Red in colour.
What is +DI?
A Positive Directional Index (+DI) is the difference between current highs and previous highs. When the positive DI moves upwards then there will be an uptrend in the market. When the positive DI moves downwards then there will be a downtrend in the market.
What is -DI?
A Negative Directional Index (-DI) is the difference between current lows and previous lows. When the negative DI moves upwards then there will be a downtrend in the market. When the negative DI moves downwards then there will be an uptrend in the market.
Time frame to use in ADX indicator?
To use ADX indicator we must be aware of the time frame which we can enter
- For intraday trading, we should use 5 mins and 15 mins chart time frames.
- For a 2-4 days trading, we should use a 1 hour chart time frame.
- For long term trading, we should use a daily chart time frame.
How does the ADX indicator work?
The Adx indicator has a range of 0-100 where 0 denotes the weakest trend and 100 the strongest.
- If the ADX line is between 0 to 20 then it is known as a weak trend.
- If the ADX line is between 25 to 35 then it is known as a strong trend.
- If the ADX line is between 35 to 45 then it is known as a very strong trend.
- If the ADX line is between 45 to 100 then it is known as an extremely strong trend.
Types of ADX Crossovers?
There are two types of ADX crossovers, which are positive ADX crossover and negative ADX crossovers.
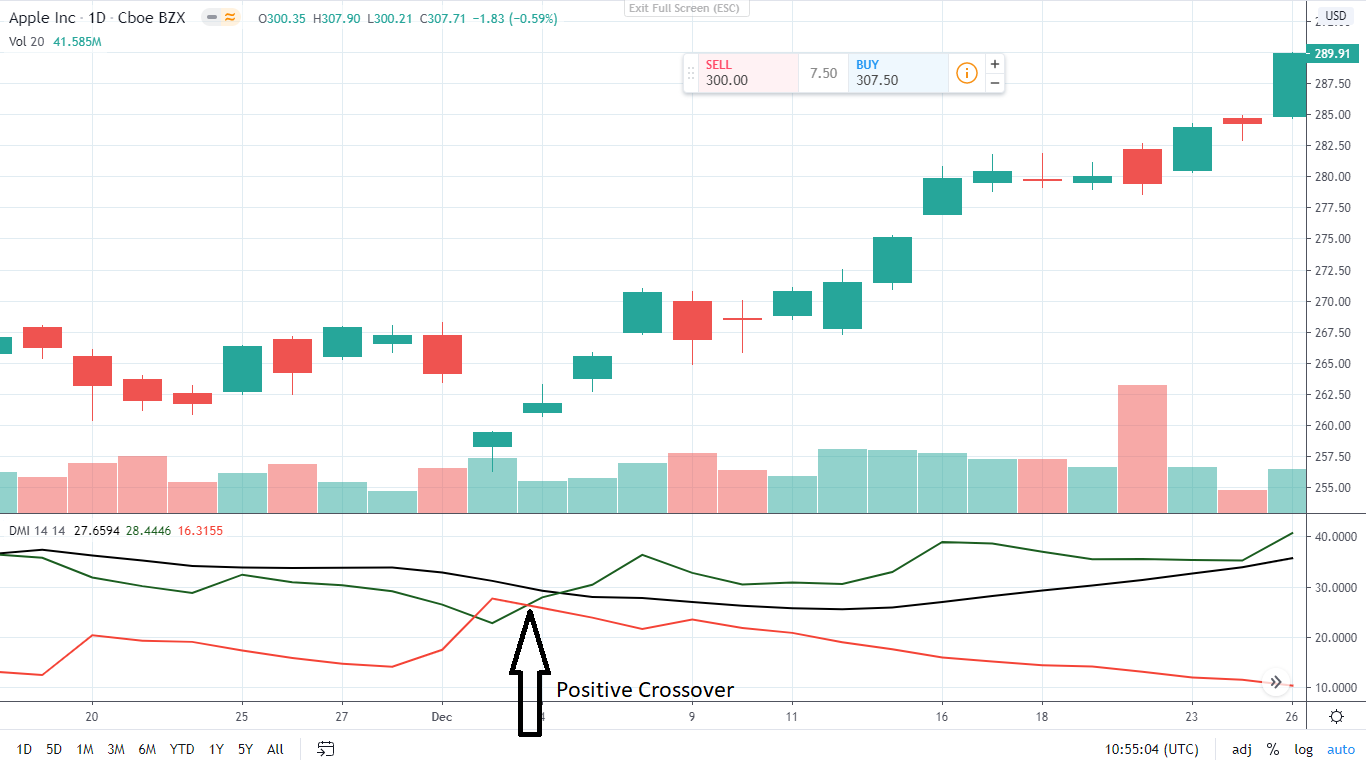
Positive Crossover
When the ADX line is above 25 and the +DI line moves upwards, which is from below to above the -DI line then this indicator is recognized as a bullish ADX crossover or positive ADX crossover line.
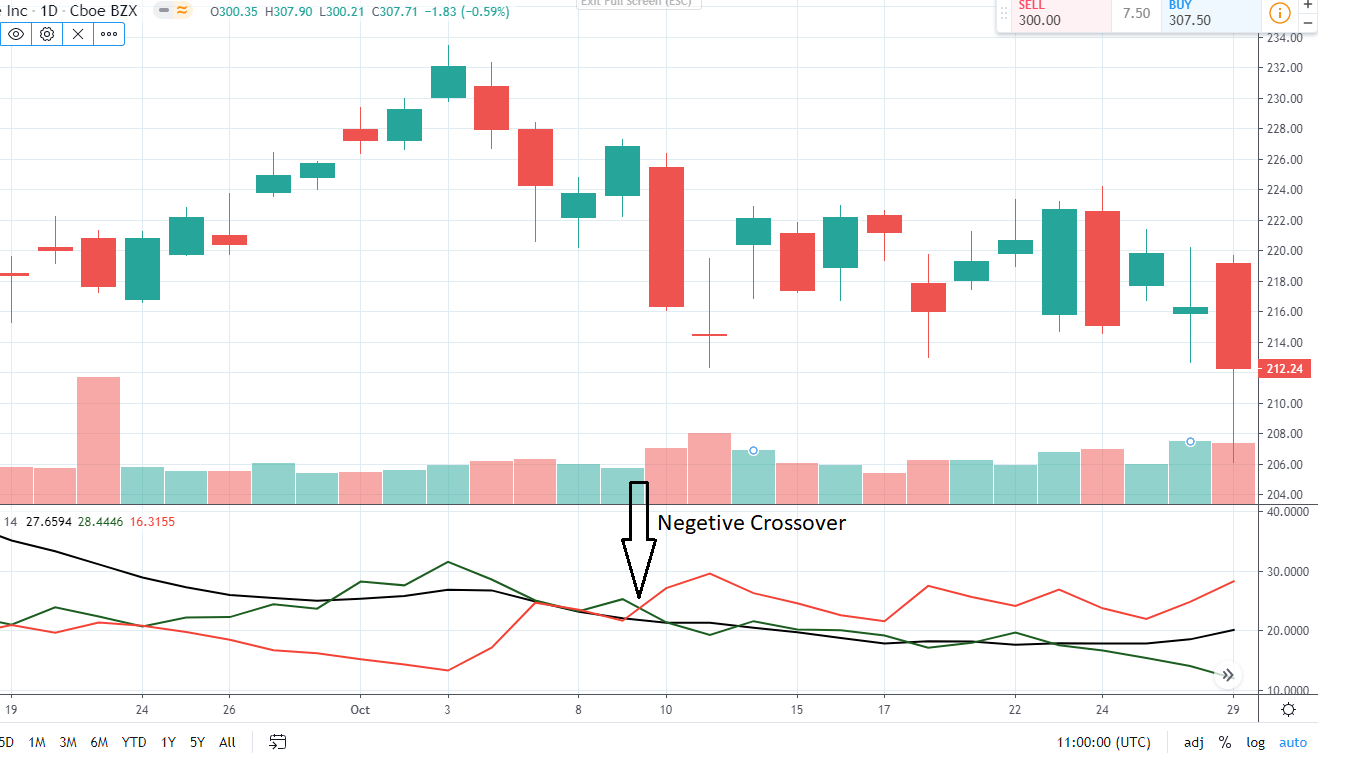
Negative Crossover
When the ADX line is above 25 and the +DI line moves downwards, which is from above to below the -DI line then it is known as a negative ADX crossover or a bearish ADX crossover.
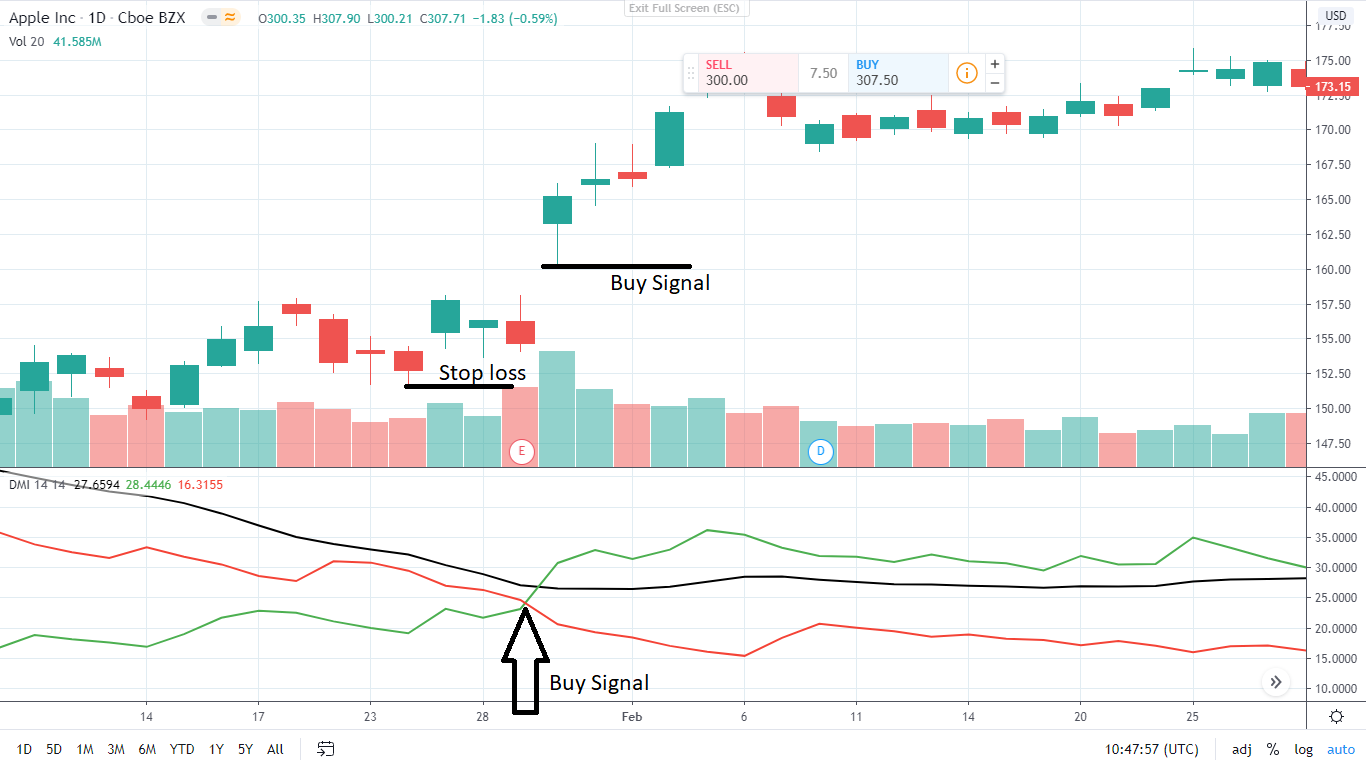
Buying with ADX?
Before buying a stock, we must analyze the trend of the particular stock in a weekly and monthly chart. If ADX is above 25 and the +DMI line moves upwards, which is from below to above the -DMI line then this indicates a buy signal.
We must buy at the next candle after the positive crossover and place the stop loss at low of the previous candle. It is advisable that the difference between stop loss and resistance must be 2% of the risk-reward ratio.
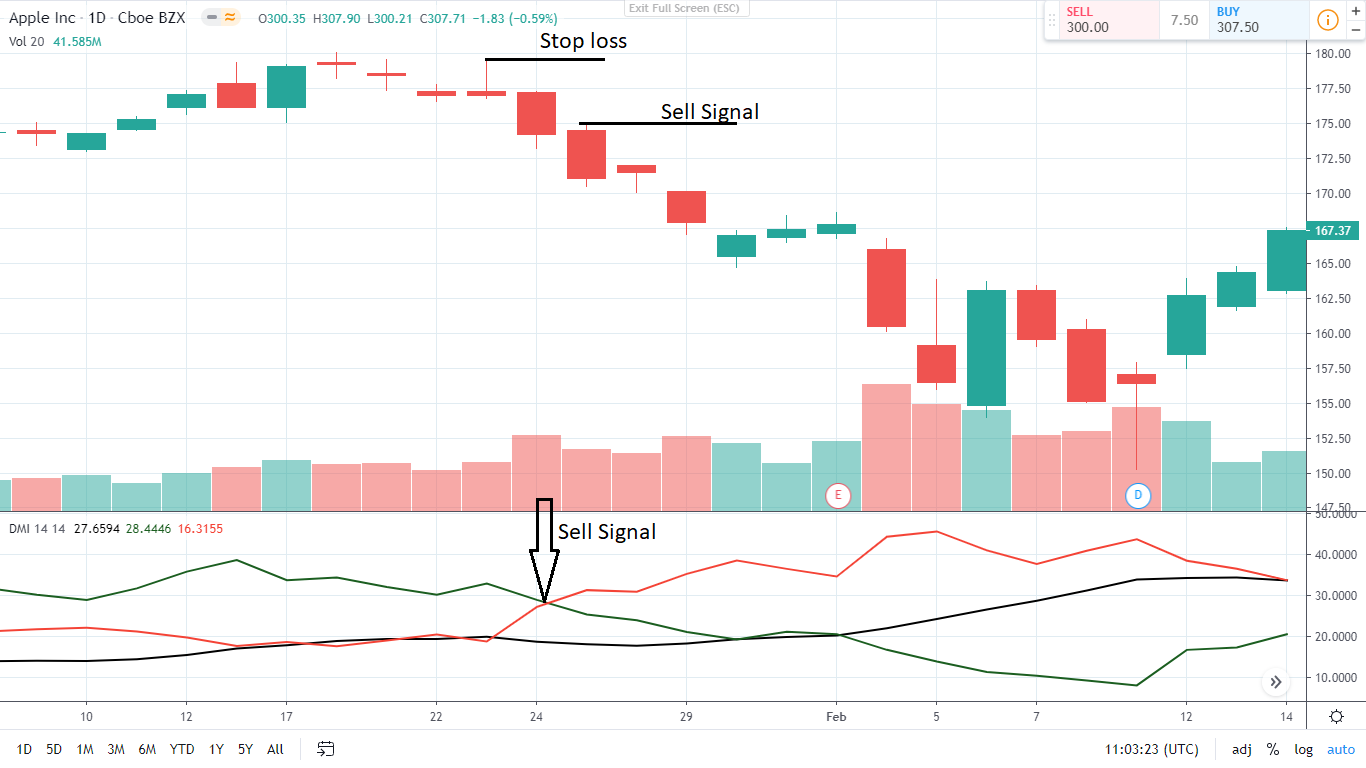
Selling with ADX?
Before selling a stock, we must analyze the trend of the particular stock in a weekly and monthly chart. If ADX is above 23 and the +DMI line moves downwards, which is from above to below the -DMI line then this indicates a sell signal.
We must sell at the next candle after the negative crossover and place the stop loss at a high of the previous candle. It is advisable that the difference between stop loss and resistance must be 2% of the risk-reward ratio.
How to increase accuracy of ADX?
ADX is plotted as a single line with values varying from zero to 100. When you take a trade, you must make sure that the Average directional index is moving upwards and is above 25. If the trend moves upwards then it resembles that the trend is becoming strong.
If the ADX is moving from above to below 25 then it resembles that the trend is becoming weak.
If you are looking to buy or sell a stock using the ADX indicator, then you must make sure that the ADX line is moving upwards and is above 25 to be more accurate
You get buying and selling signals only when the positive directional index line (+DMI) and negative directional index line(-DMI) crossover. When one of DMI’s move above 25 , that means trend is good in Markets in that side, example is +DMO move above 25 , then there is uptrend in markets and if (-DMI) moves above 25 , that means there is downtrend in markets.

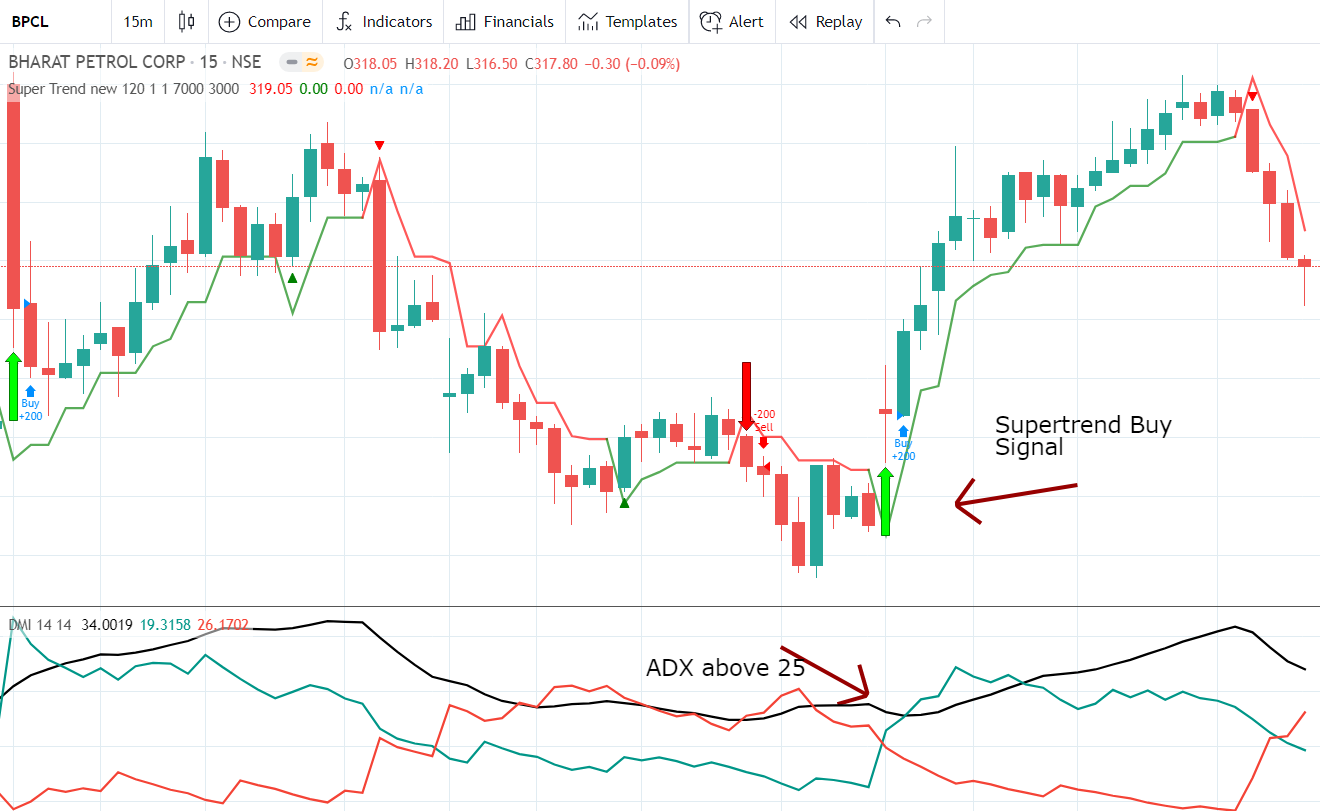
ADX with SuperTrend?
Adx indicator on alone does not signify whether the trend is Uptrend or Trend is Downtrend. It just measures the strength of current trend.
Hence when we use it with Directional movement Index indicator (+DMI and -DMI ) , we can conclude the trend direction.
Similarly , you can use ADX along with Supertrend also to take buy or sell trades. If we get Supertrend buy SIgnal land ADX is above 25 , means buy signal may work well as buy signal has come in a strong trending stock.
Also Read : What is SuperTrend Indicator and how to use it
Conclusion
ADX is a leading indicator that is used to predict where to buy and sell the shares to get the maximum profit.
By using this simple technical analysis tool, you can double your accuracy and get good results. It is used for both Short term and long term traders in the stock market.
You can find many realtime stock screener where you can find trend as well as ADX.
Recommended Brokers
 | No 1 STOCKBROKER IN INDIA Zerodha Free equity & mutual fund investments | Flat ₹20 intraday and F&O trades | Rating ★★★★★ | APPLY NOW |
 | GET FREE DEMAT ACCOUNT Upstox Fix brokerage of Rs. 20 per trade | Rating ★★★★ | APPLY NOW |
 | GET FREE DEMAT ACCOUNT Angel Broking 0 Brokerage on Equity Delivery | Rs 20 per order for Intraday and F&O trades | Rating ★★★★★ | APPLY NOW |