Table of Contents
What is the P/E Ratio?
The Price Earnings Ratio (P/E Ratio) is the bond between an organization’s stock value and earning per share (EPS). It is a famous ratio that gives investors a superior feeling of the value of the company. The P/E proportion describes the motives for the market and is the amount you should pay per unit of current earnings.
Formula for P/E Ratio:
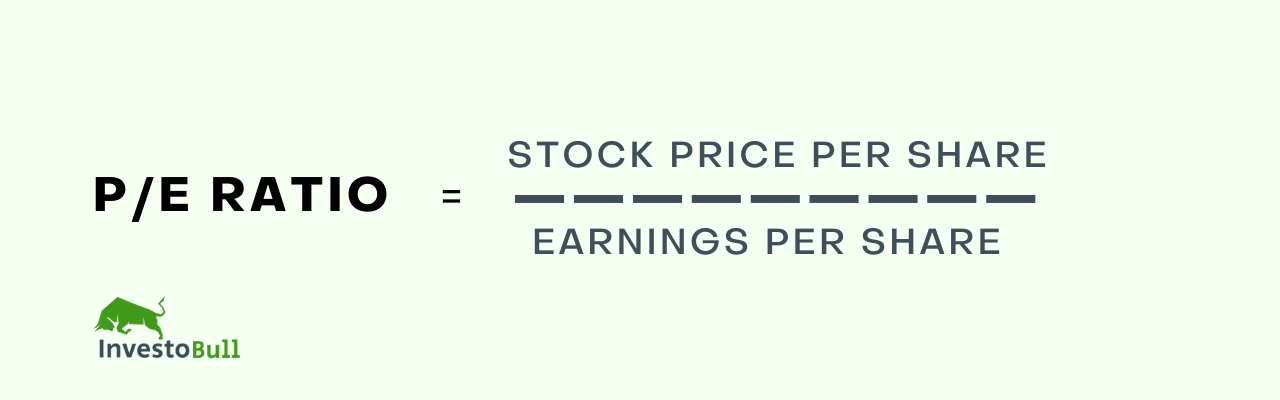
For Example:
If the current price of a stock = 200
If the stock earned = 5 rupees/share in the last 12 months for the shareholder
P/E Ratio = 200/5 = 40
- In the above example, we got the P/E ratio as 40.
- To own this particular stock, we are willing to pay rupees 40 for each stock.
- If the P/E ratio is lower then we can say that the stock is cheap to buy.
- If the P/E ratio is higher then we can say that the stock is expensive to buy.
P/E Ratio can be an Important Factor that helps you to choose between 2 stocks. If
- Market Capitalisation
- Growth rate
- Debt
- Risk
- Consumer Market
- Market Segment. etc
We cannot compare 2 stocks on the same basis for the P/E ratio if the market segment is different.
For Example:
- The Capital intensive stock infrastructure, auto etc will usually have a lower P/E ratio than the others.
- If a company seems to be promising a study growth rate in its earnings and you might want to pay a premium price to own the stock. As you can be sure to get back your money as early as possible.
- You might also have to pay a higher price for a stock. Which seamless risky, and delivered study performance in the past.
- A Debt return company P/E ratio might look good but the debt company is not accounted for the P/E ratio.

Trailing P/E Ratio
P/E ratio where the earnings of the past 12 months is considered as Trailing P/E ratio. But the past performance of a company may or may not be repeated.
- A low P/E ratio indicates an undervalued market.
- A Higher P/E ratio indicates an overvalued market and also it gives you exit opportunities.
- It also provides an opportunity to book profits and shift your funds to debt as the market may see a correction and as a result, it may come down.
- Undervalued market indicates that you should invest in equities to participate in the stock appreciation.
- If the P/E ratio of an index is below 16 then it is considered as Lower/ Undervalued (however take note of forward looking PE ratio)
- If the P/E ratio of an index is above 21 then it is considered as higher/Over Valued
- P/E ratio should not be considered as the sole criteria to buy the stocks.
- If the P/E ratio of a stock has debt then you need to find why it has happened rather than believing it blindly. Then you can think that it is a good time to buy the stock.
- The forward P/E ratio is based on the analysis of research analyst which can be speculative. An author term called Forward P/E ratio which is based on the expected earning on the upcoming 12 months.
Suggestions: Using the Intradayscreener app, you can easily find the best stock to trade in the stock market
What is the Forward Price-to-Earnings Ratio (Forward P/E)?
The forward price-to-earnings ratio is the same as the price-to-earnings ratio. The regular P/E ratio means Stock Price per Share divides the Earnings per Share of a company, whereas the forward price-to-earnings ratio means the Current stock Price divides the Expected Future Earnings per Share of a company. Therefore, if the forward P/E ratio is more than the current P/E ratio, it means limited expected earnings.
Formula for the Forward P/E Ratio

For example, if a firm has a current stock price of R 200, and the upcoming year’s earning per share is assumed to be Rs 20, then the firm has a forward P/E ratio of 10.
The toughest part of calculating the ratio is finding the company’s estimated future Earning Per Share. The best platforms to find estimates are Equity research reports, Bloomberg, Capital IQ, Google Finance, Create your own estimate.
What is a PEG Ratio?
A PEG ratio, or Price/earnings-to-growth ratio, means the Price to Earnings ratio of a company divided by the Earnings per Share growth rate over a particular period. The PEG ratio shows the correlation between share price, EPS, and the company’s growth rate. The PEG ratio balances the traditional P/E ratio by estimating the Earnings per Share growth rate in the future. Using the PEG ratio, investors can easily compare the companies with multiple PE ratios and growth rates.
Formula for the PEG Ratio
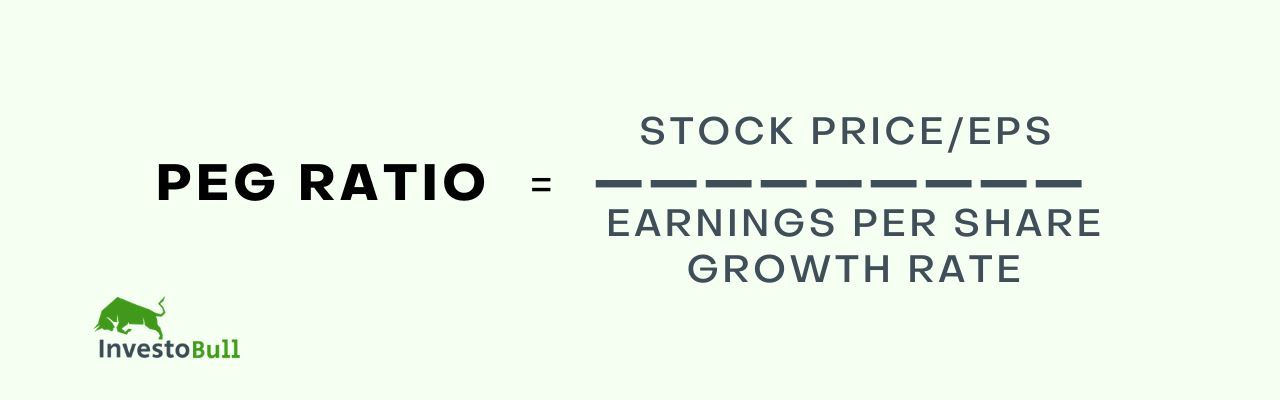
For example, if company A has a P/E ratio of 20 and a predicted growth rate of 20%, then the PEG ratio will be 1 (20/20). So to calculate the PEG ratio, you need three things: stock price, EPS, and the company’s growth rate.

List of top Performing Companies
Here you can find top performing company salong with P/E ratio, PEG ratio, Market capitalization
| S.No. | Name | P/E Ratio | Mar Cap Rs.Cr. | PEG Ratio |
| 1 | Bhansali Engg. | 7.78 | 2598.08 | 0.09 |
| 2 | Supreme Petrochem | 15.19 | 7254.16 | 0.29 |
| 3 | IOL Chemicals | 8.77 | 4028.96 | 0.18 |
| 4 | Castrol India | 18.67 | 13095.98 | -15.69 |
| 5 | Balmer Law. Inv. | 12.51 | 1061.38 | 0.67 |
| 6 | Mangalam Organic | 7.86 | 667.9 | 0.13 |
| 7 | VST Industries | 16.53 | 5137.58 | 0.96 |
| 8 | Kanchi Karpooram | 10.31 | 541.4 | 0.07 |
| 9 | INEOS Styrolut | 8.34 | 2337.97 | 0.24 |
| 10 | Supreme Inds. | 29.22 | 28497.21 | 0.86 |