The Head and Shoulders pattern is a massively used charting pattern, providing clear signals for buying and selling stocks. Traders and stock analysts continuously analyze trends and patterns while viewing the stock market to identify the next feasible price movement.
Recognizing the correct patterns, and understanding their importance, is an essential step for traders. The head and shoulders pattern is important because of its previous movements, analyzed by the market analysts.
In technical analysis, the head and shoulder pattern used to forecast the chart formation generally shows a reversible trend where the market moves from Bearish to bullish or bullish to bearish.
However, in this pattern, due to price volatility in the head and shoulders, sometimes the pattern structure on the chart is not well-shaped in its appearance.
There are various components in the head and shoulders pattern. Here is the list
Table of Contents
Head and Shoulder components
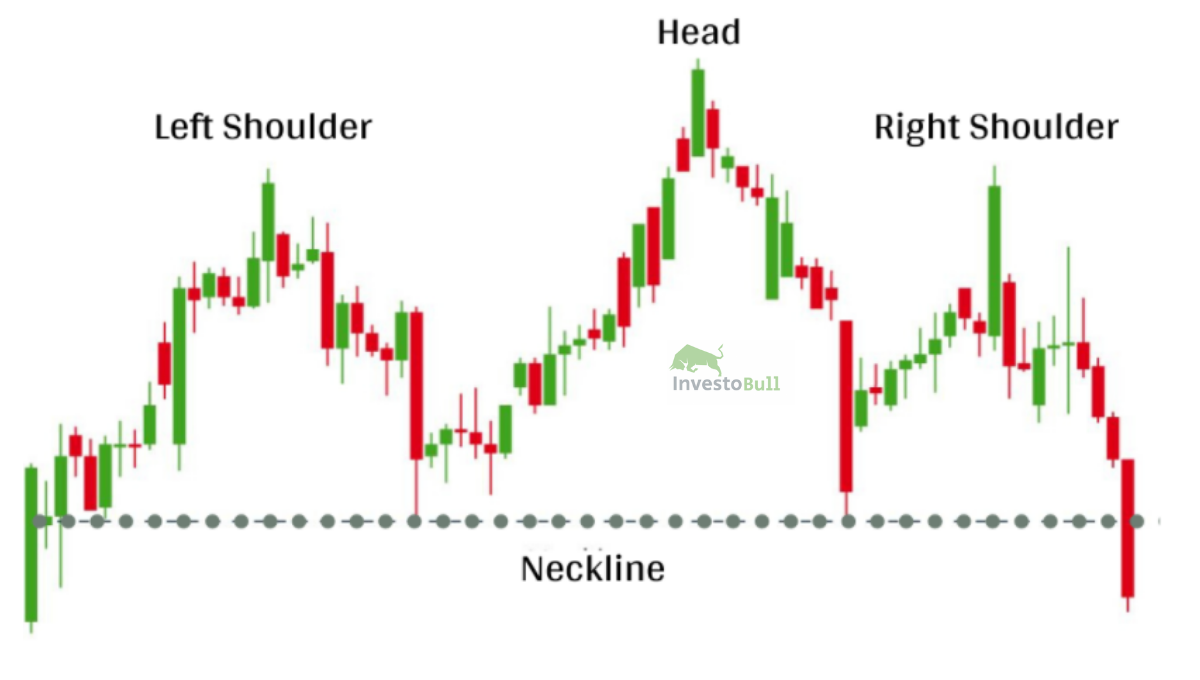
Left Shoulder:
If the stock price is moving upwards, we can consider it in bullish mode and make higher highs. But, these higher highs are short-lived, and the stock price will start moving downward.
Head:
Stock Prices will not move downwards for long because more traders will buy the stocks. At this position, the stock price will exceed the previous high(left shoulder), and it indicates the stock is bullish. At a certain point, the stock price will start moving downwards, only to find support again.
Right Shoulder:
The traders will push the stock price from support again, but they cannot reach a higher high this time. We consider it a lower high because bears will not allow the bulls to create a higher high. The bears will force the stock price back to support.
If the stock price breaks the support line, we can clearly say that bears are in charge, and hence, when the stock price ends below the support line, a possible sell signal is provided.
Inverse Head and Shoulders Components
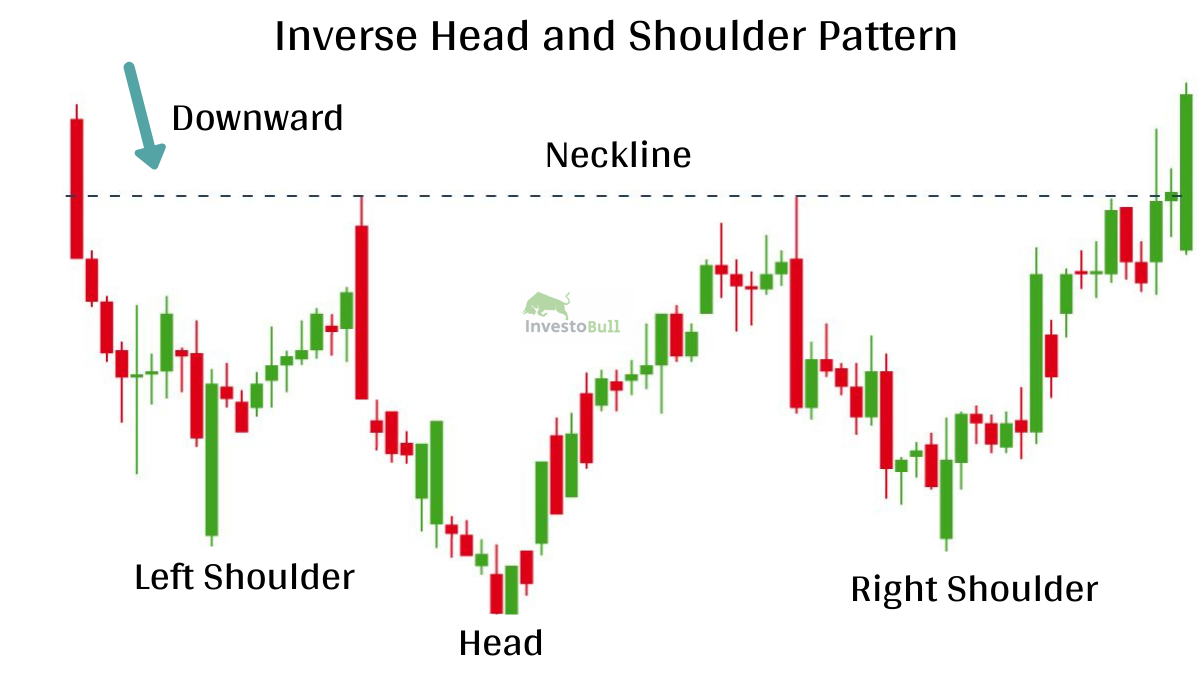
Left Shoulder:
Bears push stock prices downwards to form a higher low, and bulls start pushing the stock prices slightly higher.
Head:
Here, the stock price will not move upward for a long time and bears push stock price much lower than the previous low (Left shoulder), and it indicates the market is bearish.
Right Shoulder:
The bears push the stock price downward again, but this time they cannot form lower lows. Therefore, we can consider it a bullish sign, and bears cannot push stock prices downwards. At this point, the stock moves upward and reaches support.
Neckline:
The neckline is formed by joining lower points A and B. Lower point A indicates the head’s left shoulder end and origin. Lower point B shows the head end and origin of the Right Shoulder. After joining these points, the neckline can form slope up, slope down, or horizontal lines. The neckline slope will change the pattern’s degree of bearishness, and a downward slope is more bearish than the upward slope. In some situations, various low points are used to form the neckline.
Volume:
When the support line of a Head and Shoulders pattern breaks to the downside, a large volume should occur as well. Volume can be measured using indicators, but it cannot be possible all the time. Volume at the head is higher than the left shoulder and right shoulder.
Support Turned Resistance:
Once support is broken, then the support level will become the resistance. It can happen sometimes, but not always. Here the share price will revert to the support and give a chance to sell the stocks.
Price Target:
After crossing neckline support, the decrease in stock price can be determined by measuring the distance from the peak of the head to the neckline. The target price will strike once the distance is deducted for the neckline.
How to read the Head and Shoulders pattern
When trading with the Head and Shoulders pattern, measure the vertical distance from the peak of the head to the neckline, and it will assist in determining a predicted increased price. For example, if the distance signifies Rs 50 if the neckline is crossed, then technical analysts will guess the stock price will decrease to Rs 50 under the neckline.
Why is the Head and Shoulders pattern helpful for traders?
The Head and Shoulders pattern is a beneficial technical analysis tool for estimating the stock price movement from the neckline. It also shows a reversal trend when the market moves from a bullish trend to a bearish trend or a bearish trend to a bullish trend. This pattern will be one of the best patterns that guess a trend reversal. Finding this pattern can be helpful for the long term, and this is the best strategy used for trading
Advantages of Head and shoulder pattern
- Experienced traders can quickly identify this pattern
- Easy to identify for more experienced traders
- Limited risk and get good profit
- It has the potential to utilize significant market movements
- Beneficial in all markets