A rectangle chart pattern is a continuation chart pattern. It is a part of technical analysis. We already know that continuation chart patterns specify the current trend will continue for a particular time. In this article you can know what is rectangle chart pattern, bullish rectangle pattern, bearish rectangle pattern, How to recognize a rectangle chart pattern, components of components of rectangle chart pattern.
Usually, the rectangle pattern is formed by using two horizontal lines known as trend lines. The upper trend line acts as a resistance line, and the lower trend line is considered as a support line.
A rectangle pattern is formed when the price movement should reach equal highs and lows. The stock price is moving up and down between the trendline is consider as a consolidation period. It is essential to analyze the chart pattern with utmost caution before taking the buying and selling position.
Table of Contents
What is a Bullish Rectangle Chart Pattern?
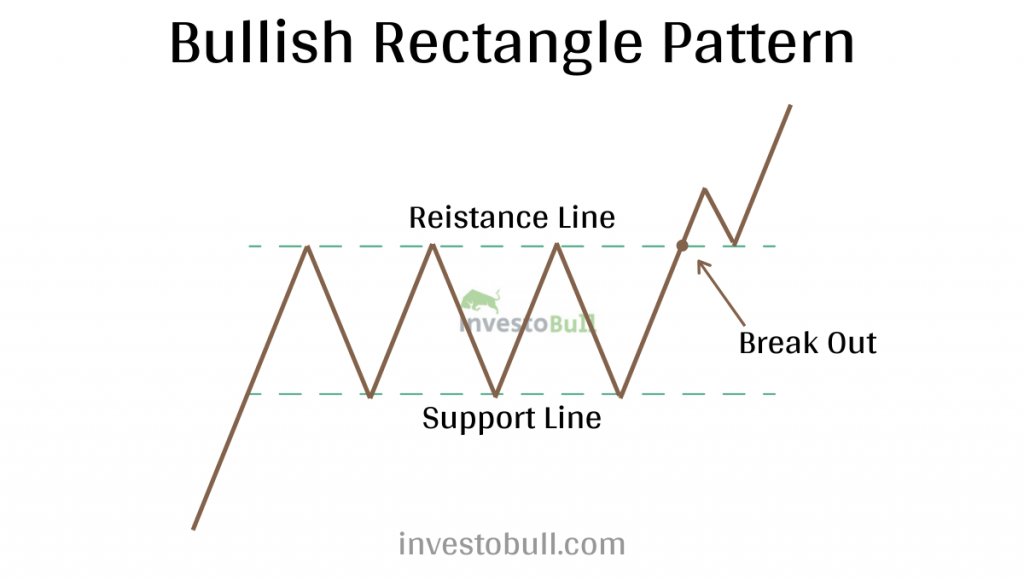
A rectangle pattern is a technical analysis pattern consisting of two horizontal lines called support and resistance lines. In a bullish pattern, the stock prices bounce between the trendlines for a particular period, after which the uptrend continues—the rectangle pattern is formed.
If the breakout happens above the resistance line, then you can identify it as a bullish trend. It is crucial to observe the breakout before confirming the pattern.
After the consolidation period, short-positioned traders secure their profits, while other traders expect a small bounce back to take the position in the market.
What is a Bearish Rectangle Chart Pattern?
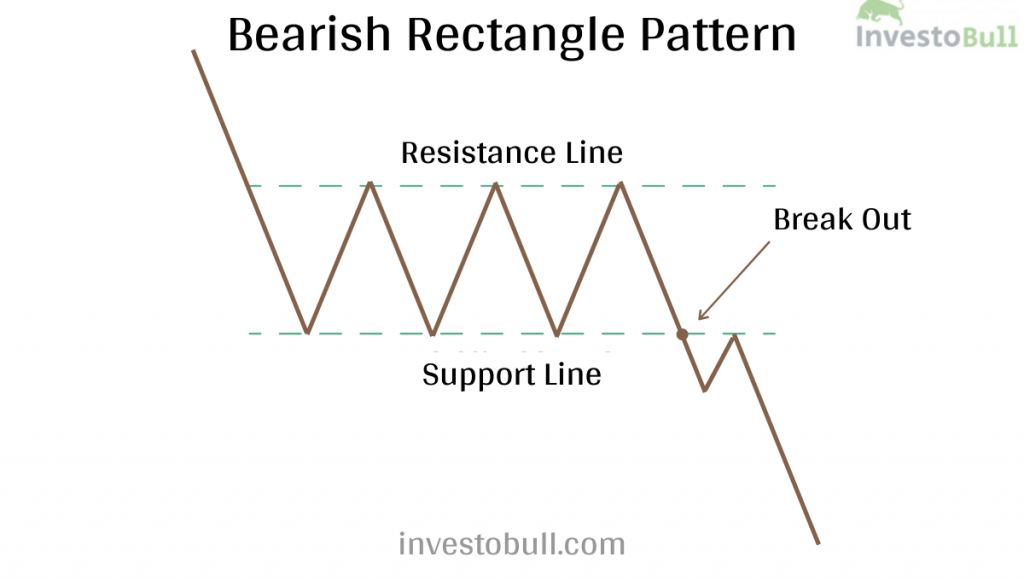
A rectangle pattern is a technical analysis pattern consisting of two horizontal lines called support and resistance lines. In a bearish rectangle pattern, the stock prices bounce between the trendlines for a particular period, after which the downtrend continues—the rectangle pattern is formed.
If the breakout happens below the support line, then you can identify it as a bearish trend. It is crucial to observe the breakout before confirming the pattern.
After the consolidation period, traders expect a small bounce back to short their position in the market.
How to Recognize a Rectangle Chart pattern
A rectangle occurs in a consolidation period when the market requires certainty about price movement, whether it is moving upward or downward. Like other continuation chart patterns, the rectangle is formed by two or more continuous highs or lows with almost the same volume. The traders will draw a line by connecting the upper tops known as resistance line and lower bottoms known as support line.
Components of Rectangle Chart Pattern
Trend:
For a continuation chart pattern, a previous trend must exist. Similarly, the trend must be a few months old and not more than that. If the trend is created more than months ago, there will be a limited chance of a continuation pattern.
Resistance and Support:
To draw a resistance line and support lines, traders need two similar highs and lows. These price movements should not be the same but slightly vary.
Volume:
Rectangle patterns don’t have standard volumes. Sometimes volume will decrease as the pattern develops. Other times, the volume will be volatile as the stock prices move up and down between the support and resistance. There will be a high volume after the breakout.
Duration:
A rectangle pattern can continue for a few weeks or months. If the pattern period is lower than three weeks, it is recognized as a flag pattern, also a continuation pattern. Similarly, a rectangle pattern will occur over three months.
Breakout Direction:
The direction of the rectangle pattern can be decided after the breakout has happened. Rectangle patterns are indeterminate patterns that are depending on the future price breakout. If the breakout has happened above the resistance line, it is in a bullish market, and if the break out has happened below the support line it is considered as bearish market.
Target Price:
Once the breakout has happened, the target price prediction is determined by measuring the longest distance between support and resistance lines, and it will be placed above the resistance line for the bullish market and below the support line for the bearish market.
Rectangle Buy and Sell Signals
A buy signal is recommended when the stock prices break out above the resistance line and sell signal is recommended when the stock price breaks out below the support line. Some traders will wait for retesting to take the position.

Advantages of Rectangle Chart Patterns
- It is very easy to define support and resistance lines inside the rectangle
- It can perform in various markets
- It is easy to understand for beginner traders
- Entry position and stop-loss are simple to identify
- It can be used as a breakout strategy strategy
Recommended Brokers
 | No 1 STOCKBROKER IN INDIA Zerodha Free equity & mutual fund investments | Flat ₹20 intraday and F&O trades | Rating ★★★★★ | APPLY NOW |
 | GET FREE DEMAT ACCOUNT Upstox Fix brokerage of Rs. 20 per trade | Rating ★★★★ | APPLY NOW |
 | GET FREE DEMAT ACCOUNT Angel Broking 0 Brokerage on Equity Delivery | Rs 20 per order for Intraday and F&O trades | Rating ★★★★★ | APPLY NOW |