
Table of Contents
What is Multi time frame analysis?
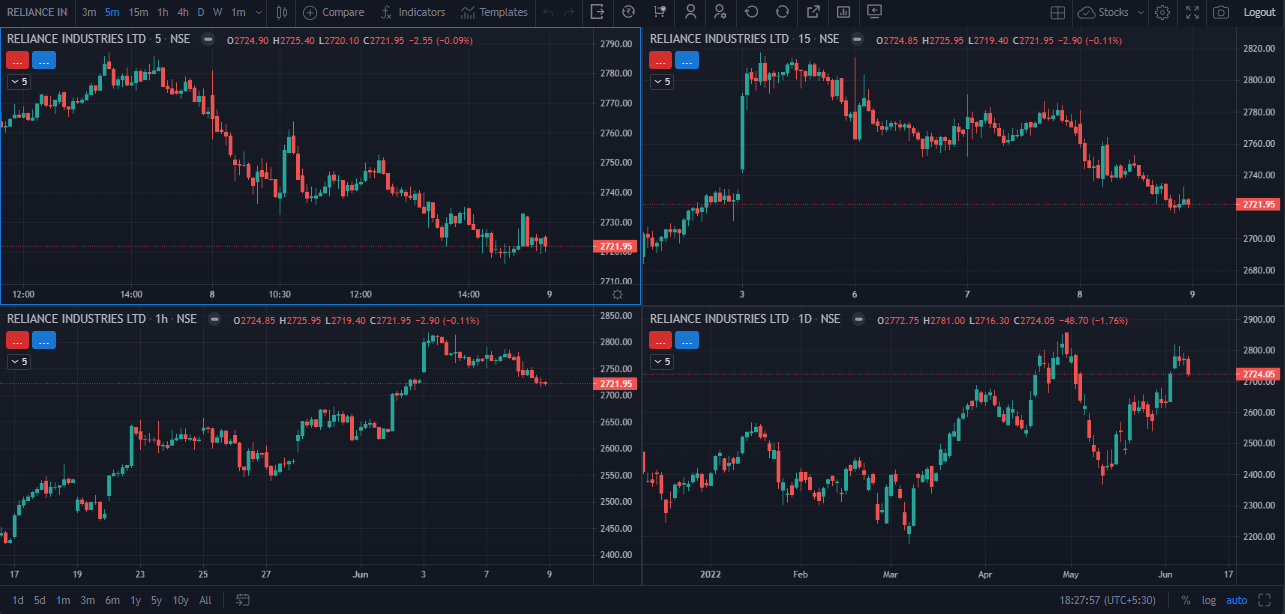
Multiple time frame analysis is a process of viewing the same stock in 4 different time frames. Usually, the larger time frame is used to make a longer-term trend, while a shorter time frame is used to day trading entries into the market.
Multi timeframe analysis is one of the most important things one should be doing before taking any trade. Multiple timeframe analysis will help you, in reducing loss from your trades.
Tracking Multi TimeFrame Trading
The longer the TimeFrame, the more reliable signals will be. As the time frame gets reduced, the chart may give false signals. Traders should use a long time frame to know the trend of the stocks they are trading.
Once the trend is defined, the traders can use any time frame like 1 month or 1 week to identify the long-term trend and a faster time frame like 1 hour and 15mins to identify the short-term trend.
Recent Post: What is Volume in the stock market? How to use volume while trading?
Use of Multi Timeframe Trading
A trader should individually choose the multi-timeframe analysis and then choose a time frame above or below to require the time frame.
- An Intraday trader can use a 60 minutes chart to identify the primary trend and a five-minute chart to identify the short-term trend.
- A Swing trader can use weekly charts to identify the primary trend and 60 minutes charts for identifying the short-term trend.
- A Positional Trader uses monthly charts to identify the primary trend and daily charts to identify the entries and exits.
Entry Principle for Multi Time Frame Analysis
Here are entry principles for Multi Time frame analysis for trading
- You should know what your “signal” chart is. For swing traders, this will be a Daily chart and for Day traders, it will be a smaller time frame like a 2/5/10/15 minutes chart
- You should add a higher time frame chart that is either 5x or 25x larger than your signal chart.
- You should trade your signal chart as before, but trade in the direction of the swings on that higher timeframe chart.
Benefits of Multi Time Frame Analysis
Here are the benefits of using Multiple Time frame analysis for trading
- The support and resistance may be near your trade, but this cannot be seen in the time frame in which you are trading.
- Risk can be managed more effectively by combining time frames.
- A trader can learn to move stops on smaller time frames for patterns that complete on larger time frames.
- You can make precise entry points shorter time frames than longer time frames.