Support and resistance levels are very important concepts in technical analysis. Support and resistance levels help us to decide Entry , Exit and Stop loss . There are various tools used to find the support and resistance level in the stock market. While trading in the stock market, unless you understand concept of support and resistance, it not possible to trade successfully.
If you’re new to the stock market world, it is better to know the concept of support and resistance levels. This is because various trading strategies are depending on the basics of support and resistance levels.So lets understand in detail what Is support , what is resistance and how to use support and resistance in Intraday / swing trading.

Table of Contents
What is Support?
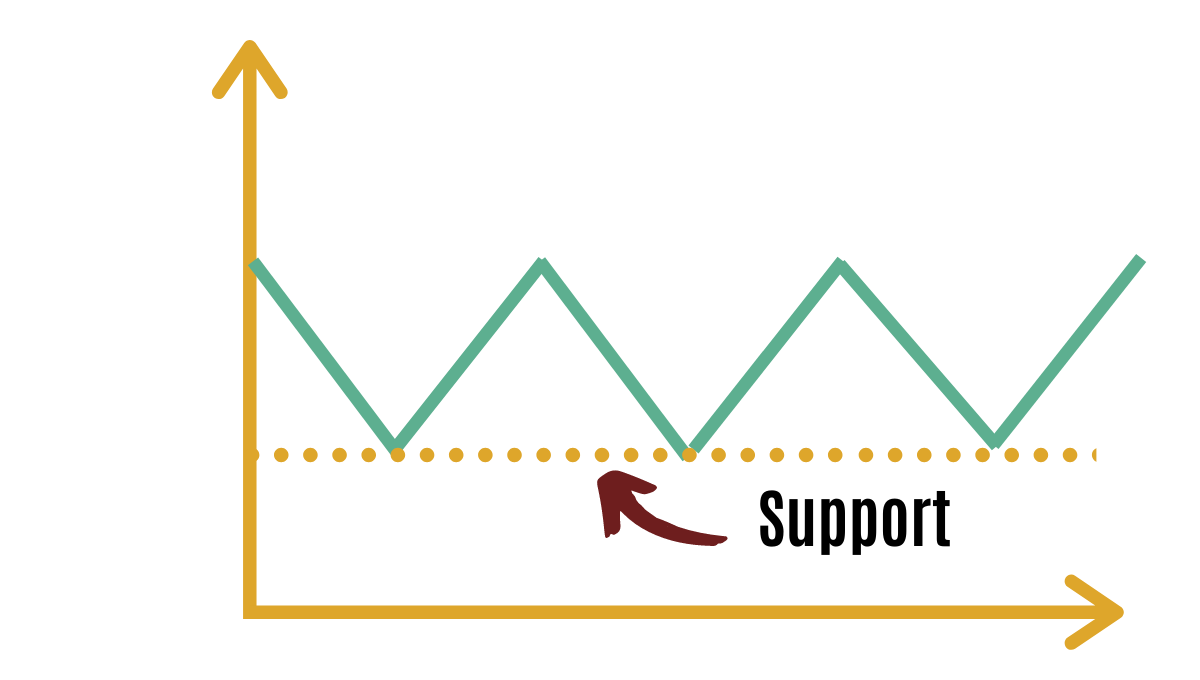
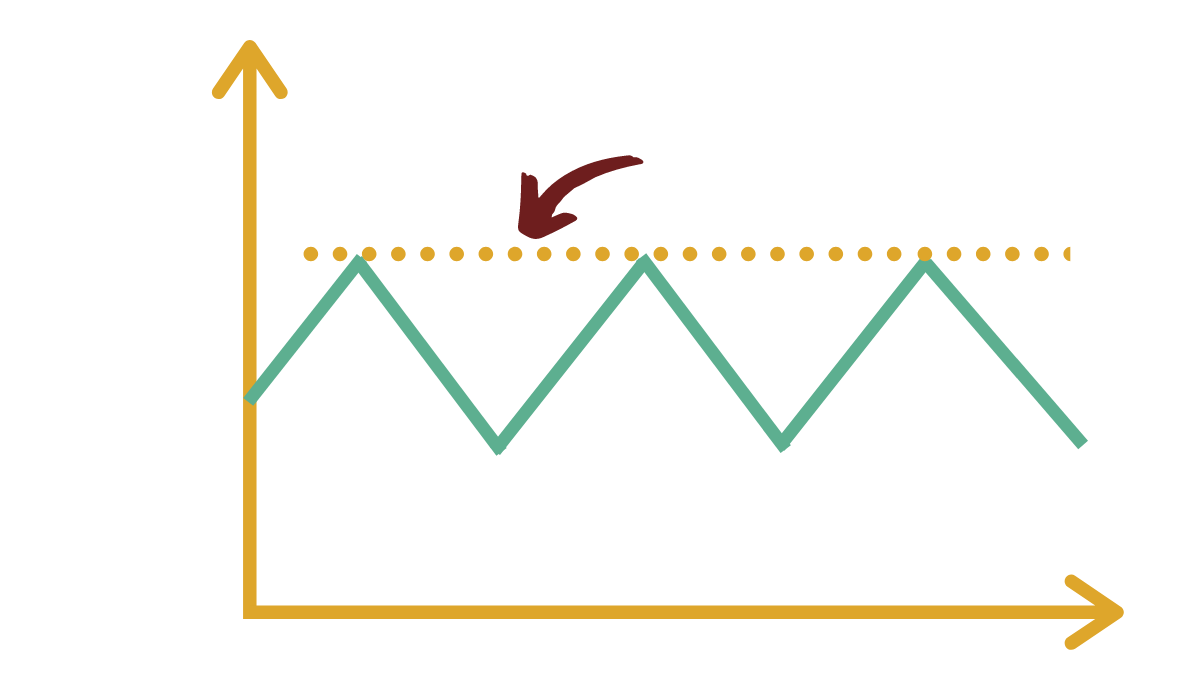
Support is the level at which demand of any stock is more than supply. In simple words , it is the share price at which you can expect buyers will be more than sellers. In trading , support is the place on the chart where fresh buying emerges and stock stops falling further. It’s a zone on a chart where there is a high probability of reversal . Lets understand it with the help of the image below.
Example:
In the image above , you can see the yellow dotted line. This line acts as a static support level and stock bounces from that level on falling. When the second time stock reaches the same level, we know that in past buying has emerged from these levels. So it’s highly likely that stock will stop falling and rebound from these levels..
When will support become resistance
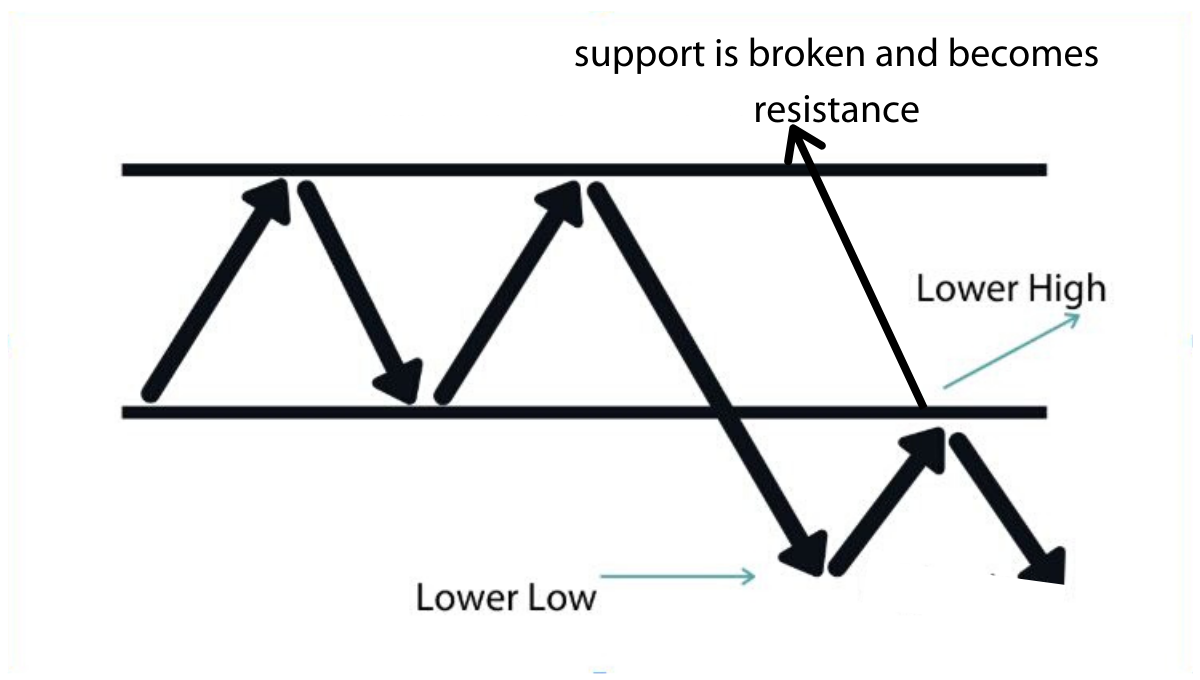
Supports become resistance if the market continues to make lower lows and lower highs and when support is broken and the market heads down. Once a support is broken in market (when stock falls below that level) , it becomes resistance level on the chart when stock tries to move up again .
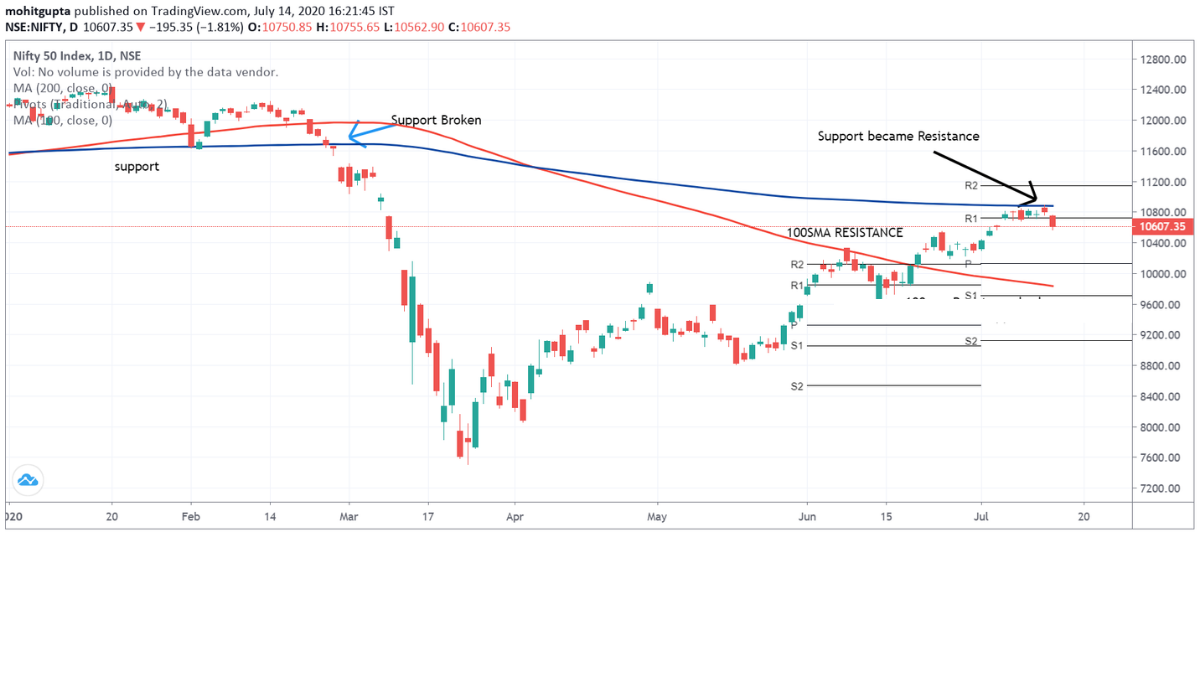
The figure below shows the chart of Nifty 50. Using this chart, we get a clear idea of support and resistance levels and the influence on the market. In the below image the 100 day moving average (red line) 100 DMA was acting as resistance around 12th june. When stock touched the 100 day moving average line (red line), it fell down from there. Second time when stock crosses 100 day moving average and closes above that , 100 day moving average now becomes support for stock.
Similarly , 200 Day moving average (200DMA ) was support levels of the stock. When 200DMA was broken , stock fell down. Once stock falls below 200DMA , it is now a resistance level. We can see when stock again tried to touch 200DMA, it fell down from there.
What is Resistance?
Resistance is the level at which supply is more than demand to prevent the stock from moving upwards. In the resistance zone, you expect more sellers than buyers. Resistance is usually a zone from which stock will fall below. If resistance is broken , it will become supports going forward.
Example:
In the figure above , we see that the yellow line is the resistance level. Since the sellers are more than buyers, stock tends to fall down after touching these levels.
When will resistance becomes support
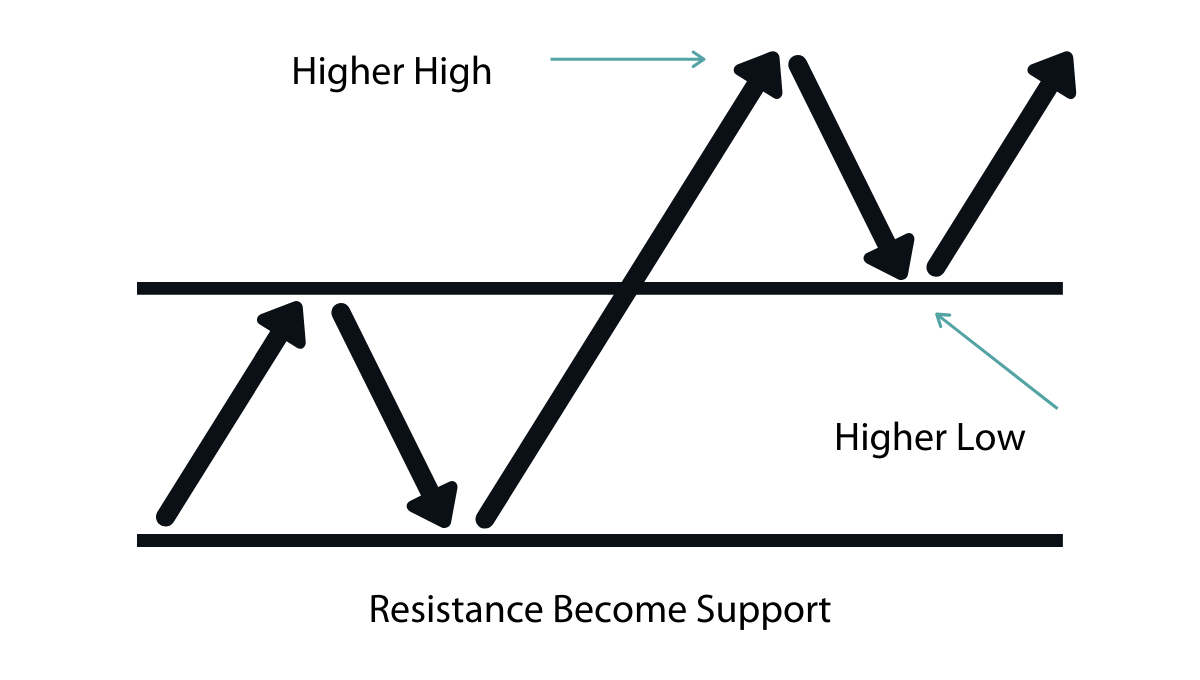
If the market continues to make higher highs and higher lows, then you can consider the market is in an uptrend. When stock breaks a resistance level , the level will start to act as new supports . In the image below , you can see how resistance was broken and then it became supports when price was moving down after crossing resistance.
Different types of support and resistance levels
There are several types of support and resistance lines in the stock market. Here is the list of the most important levels that every trader must know,
- Static Support and Resistance Level
- Dynamic Support and Resistance level
Static Support and Resistance Level
Lets understand the concept of resistance and support level. A static support or resistance level are ones that never change with time—examples of static support and resistance levels.
- Horizontal support and resistance level
- Pivot points
Horizontal support and resistance level
When drawing the static support and resistance levels, it is essential to know that those levels are represented using a horizontal line.
Horizontal support and resistance levels are the most fundamental type of these levels. A horizontal line identifies them. Firstly, you have to find the last price from where a stock has reversed after falling or rising . Then fix it with a horizontal line that helps you in the future. If once the share price reaches this horizontal line again, then there is a more possibility that the share price will return from that line.
Note- While drawing, these horizontal lines better avoid fake signals. Drawing horizontal lines with candlestick charts can save you from the false signals. The image below explains how to draw the horizontal support and resistance.
Pivot Points
A pivot point is a technical analysis indicator used by intraday traders to identify the support and resistance levels in the stock market. The support and resistance levels depending on the last day’s high, low, and closing price. Traders use these pivot points to know the possible entry, Exit, and stop-loss prices for trades.
It is a level at which a share value is constant, and if this level is broken, then the stock will move towards the resistance or support level.
To determine the support and resistance level of a particular stock. The formula is
Pivot Point(PP) = Previous day (High +Close+Low)/3
Support and resistance levels can be calculated using the pivot point formula
First level Support and resistance
Resistance (R1) = (2 * Pivot point) – Low
Support (S1) = (2* Pivot Point ) – High
Second Level Support and resistance level
Resistance (R2) = Pivot point + High – Low
Support (S2) = Pivot Point – High + Low
PP = pivot point
H = Previous Day High Price
L = Previous Day Low Price
C = Previous Day Closing Price
R1 , R2 = Resistance Level
S1, S2 = Support Level
You must know pivot points are short term, overnight trend indicators those values can be useful for one day. They must be calculated every day because the share price changes every minute.
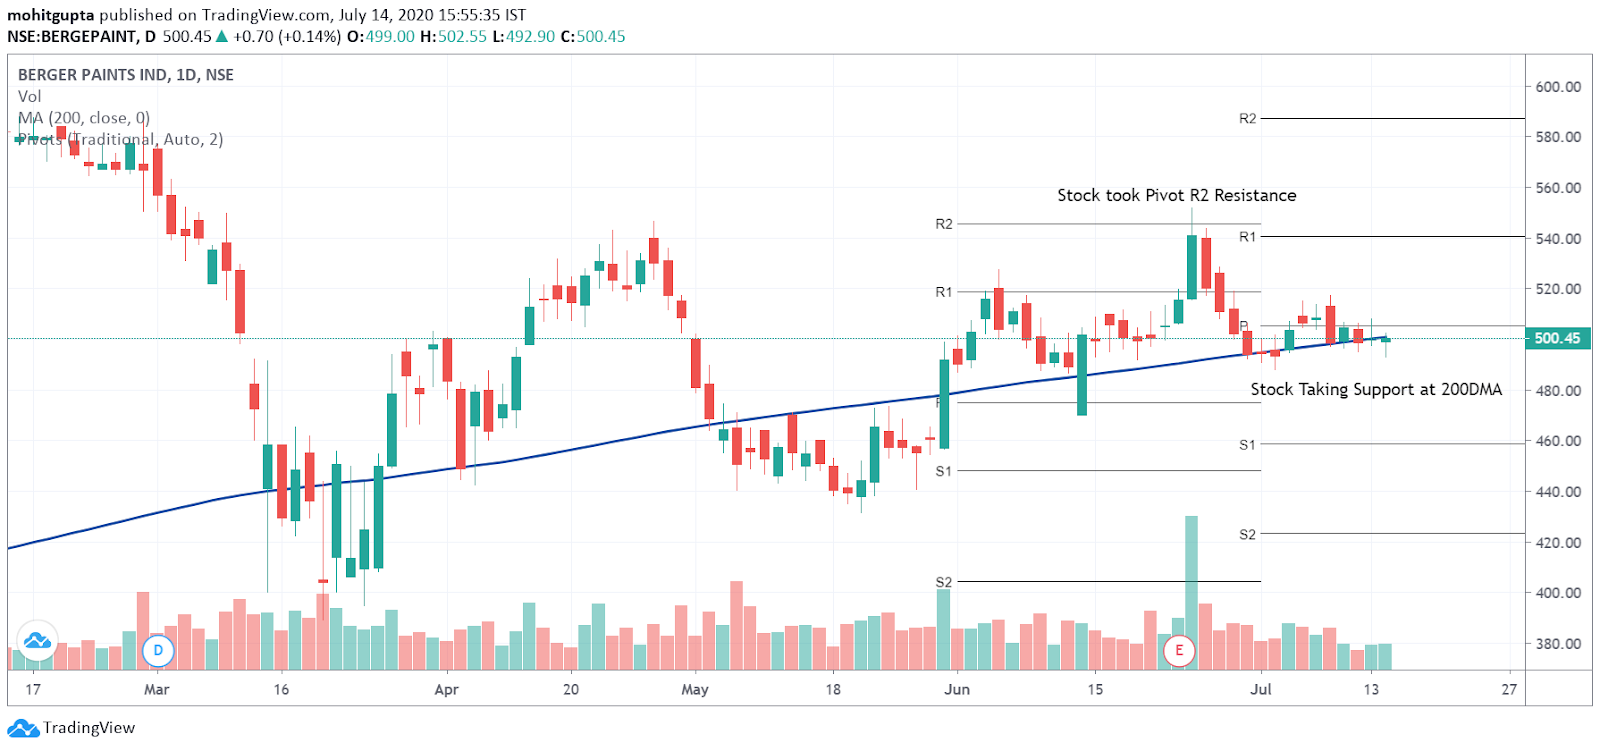
The figure below shows the daily chart of Berger Paints. Through this chart, we get a clear picture of the stock taking resistance at R2 and support at 200 day moving average DMA.
Dynamic Support and Resistance Level
Dynamic support and resistance levels are ones that vary resistance and support level with time. Example of dynamic support and resistance levels are
- Moving Average
Moving Average:
Moving average indicator is preferable for both long term and short term traders. It is easy to know the market range when traders are working with a moving average.
A moving average acts as a smoothing indicator. It is based on the previous price action for a particular period as a smooth line. There are two types of moving averages
- Simple moving average
- Exponential moving average
Simple and exponential moving averages work in the same way. They both describe previous price movement action for a specific period as a smooth line.
Example:
An excellent example of a dynamic support and resistance indicator is the moving average. By plotting the 200-day moving average, 100-day moving average, on a chart, we can use them to identify dynamic support and resistance levels. In the below image 200 SMA is Resistance point and 100 SMA is Support point.
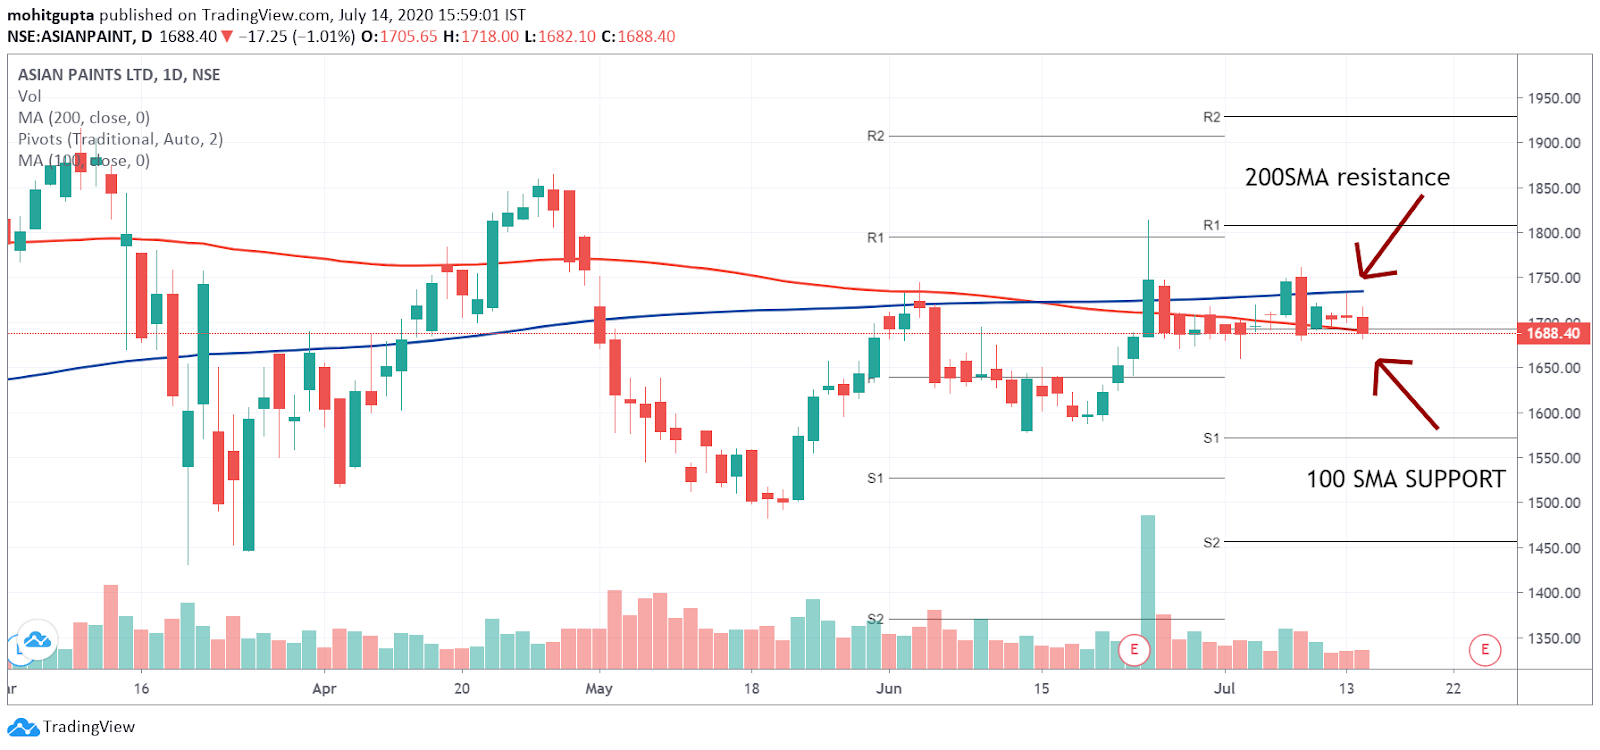
Note: The difference between static and dynamic support and resistance levels are, Static support and resistance levels are not moving. They are represented in horizontal lines, whereas Dynamic support and resistance levels are moving and can not be Horizontal.

How to find automatic support and resistance levels.
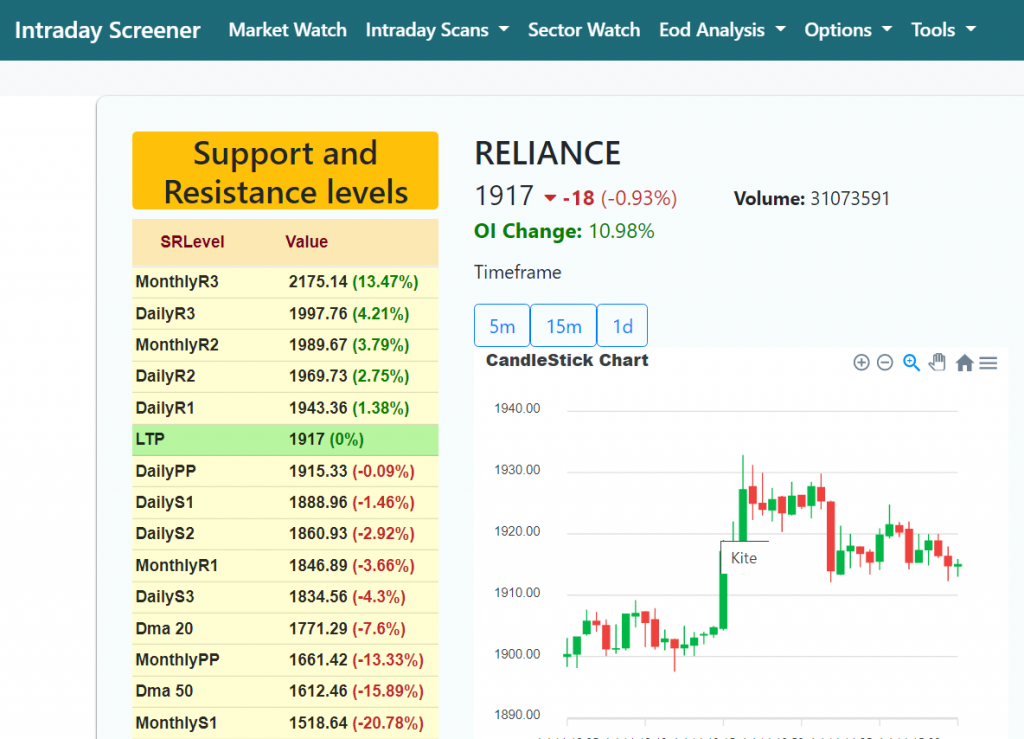
Support and resistance levels keep on changing in case of dynamic support resistance. Hence you can you stock screeners to find support and resistance levels. One of the best stock market screener to find support and resistance levels is Intradayscreener.com. You can open any stock details and find all SR levels as shown below
Also Read : What is Moving Averages
Recommended Brokers
 | No 1 STOCKBROKER IN INDIA Zerodha Free equity & mutual fund investments | Flat ₹20 intraday and F&O trades | Rating ★★★★★ | APPLY NOW |
 | GET FREE DEMAT ACCOUNT Upstox Fix brokerage of Rs. 20 per trade | Rating ★★★★ | APPLY NOW |
 | GET FREE DEMAT ACCOUNT Angel Broking 0 Brokerage on Equity Delivery | Rs 20 per order for Intraday and F&O trades | Rating ★★★★★ | APPLY NOW |