Table of Contents
What is bull call spread in options trading?
A bull call spread is an options trading strategy in which we buy one at the money call option with a lower strike price and sell one out of the money call with a higher strike price.
Example when a stock is trading at 251 rs. we buy 250 Call option (at the money) at let’s say 5rs and sell 255 call Option (Out the Money) at let’s say 3 rs. It’s a horizontal spread, which means expiry is the same for both the long and short call option.
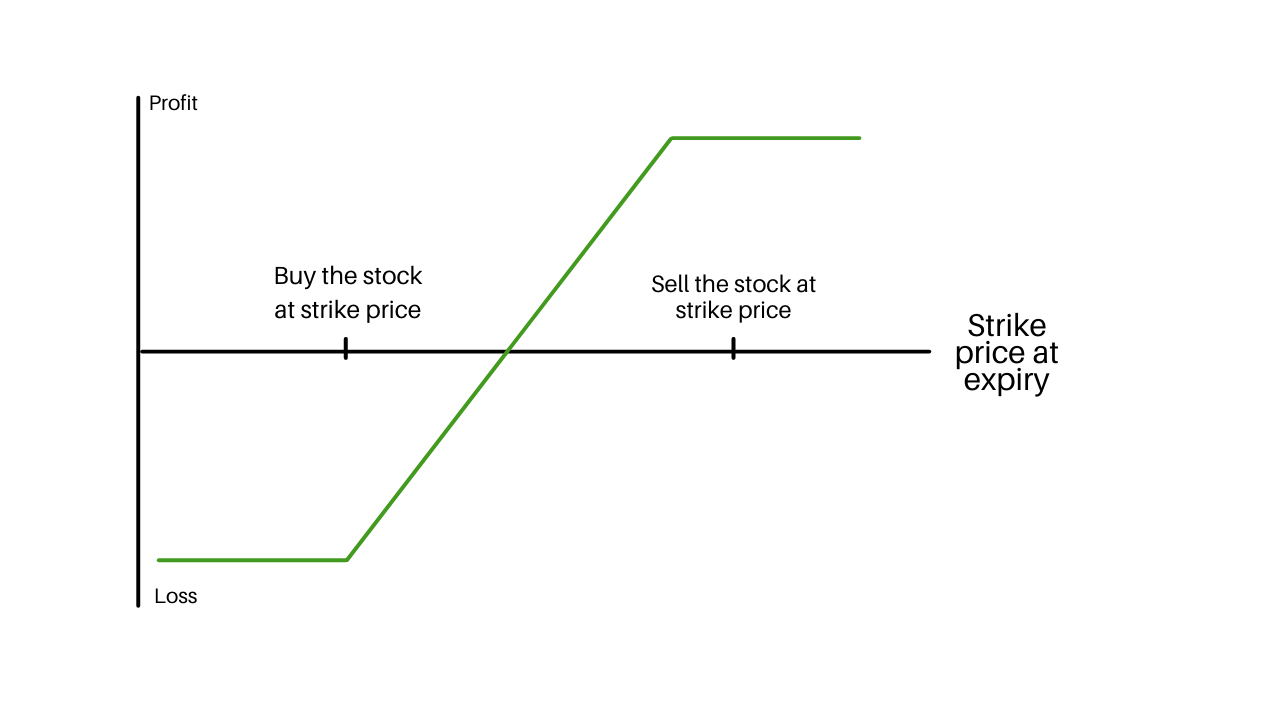
If the stock price rises above the strike price of the short call, then the profit is limited and If the stock price falls below the strike price of the long call then the potential loss is limited.
The options trader reduces the cost of placing the bullish position by shorting the out-of-the-money call. This strategy is also known as the bull call debit spread as a debit is taken upon entering the trade.
PAYOFF DIAGRAM OF BULL CALL SPREAD
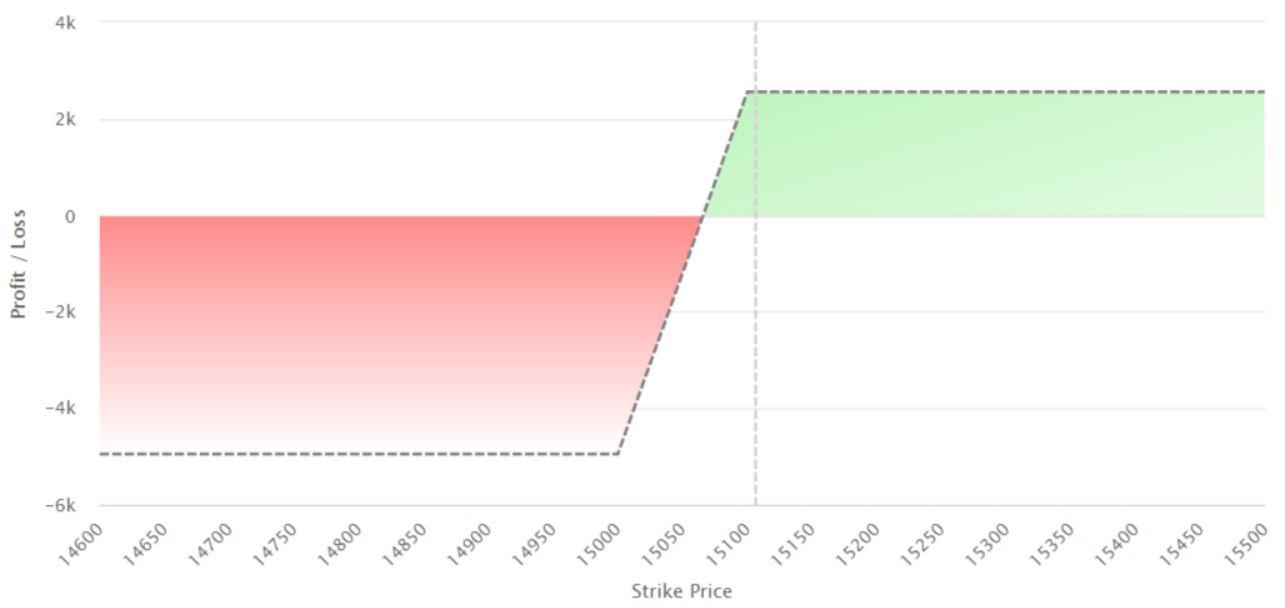
Below is the payoff diagram of a Bull call spread. A key noticeable feature of this diagram is that maximum loss is limited as well as Maximum Profits are limited, making this an excellent tool to go bullish on markets with defined risk.
Bull Call Spread – Maximum profits
In the bull call spread options strategy, the maximum profits are calculated when the stock price moves above the higher strike price of the two calls are equal to the difference between the hit price of the two call options minus the initial debit taken to enter the position.
- Maximum Profit = Strike Price of Short Call – Strike Price of Long Call-Net dividend Paid – Commissions Paid
- Maximum Profit Gained When Price of Underlying >= Strike Price of Short Call
To understand it better, let us take an example of Tata motors which is priced at Rs 180 bought for Rs 2 and selling it at Rs 190 for Rs 1 in a debit of Rs 1.
Bull Call Spread – Limited Downside risk
In the bull call spread strategy, the loss will occur if the stock price decreases at expiration. The maximum loss should not be more than the initial debit taken to enter the spread position.
- Maximum Loss = Net Dividend Paid + Commissions Paid
- Maximum loss occurs when the price of underlying <= Strike Price of Long Calls
Bull Call Spread – Break Even Point
This formula can be used to calculate the price at which break-even is gained for the bull call spread position.
- Break Even Point = Strike Price of Long Call + Net premium Paid
Let us take an example of a trader who purchased a call option priced at Rs 120 for Rs. 2 and sold out the Rs 140 option for Rs 0.50. The strike price for the purchase option is Rs 120 and the net premium was Rs(2 – 0.50) which is ₹1.50. Therefore, the breakeven point will be Rs 120 + Rs 1.5 which is Rs 121.50. If the stock price strikes at ₹121.50, then it will break even and neither make a profit nor take a loss.
Bull Call Spread – Margin required
You need to have a specific margin in your trading account to enter into bull call spread or else you will not allow placing the trade. You can calculate the margin required by using your broker terminal.
Earlier there was high margin requirements for bull call spread, but after new exchange rules, Option premium for hedged strategies have come down a lot
How to make Bull call spread Strategy?
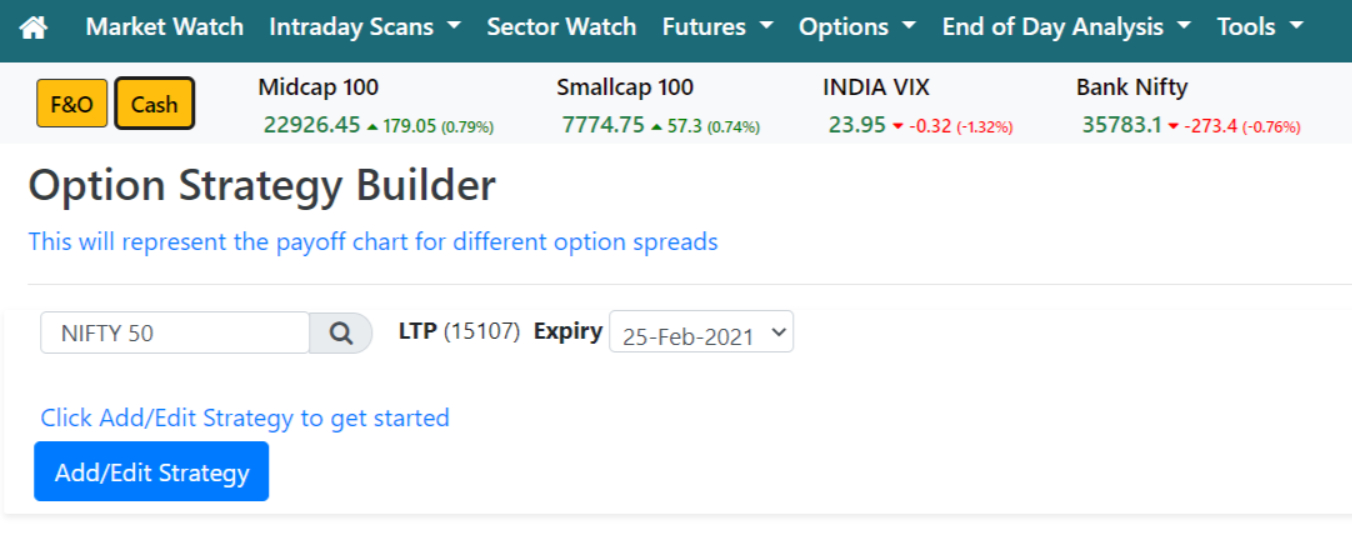
Using Options strategy builder in intradayscreener.com, you can easily build an option strategy for a bull call spread.
Step 1: You just need to select the indices and expiry date (one buy call option and one sell call option) and click on add/edit to get started.
Step 2: Click on the Bull call spread strategy below.

Step 3: You will get detailed information on the option strategy like Premium, Max profit at expiry, Max losses at expiry, Breakeven at expiry, and a Bull call spread graph.

Bull Call Spread Example 1
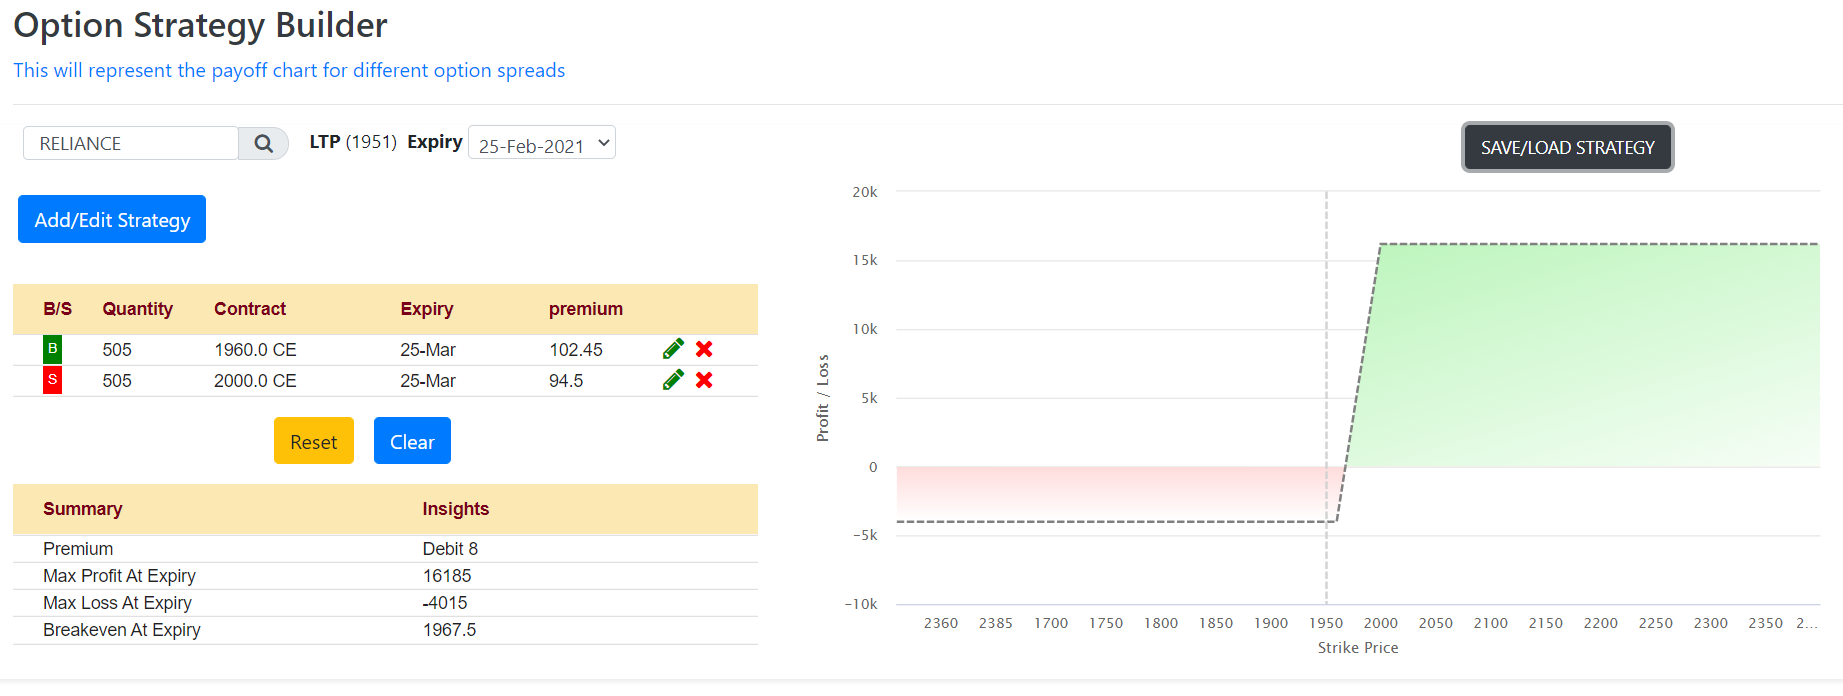
Let us take an example, If you are willing to buy Reliance call option priced at Rs 1951.
To gain profits in this trade, you need to buy the contract at 1960CE at a premium of 102.45 and sell it at 2000CE at a premium received of 94.5.
The Max profit at expiry will be 16185, the Max loss at expiry will be -4015, the Breakeven at expiry will be 1967.5.
Bull Call Spread Example 2
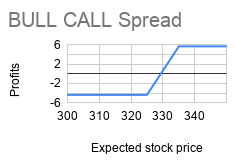
Let us take an example of Tata motors with the strike price of 325, buy and sell prices given in the table below
| Action | Type | Strike price | Premium |
| BUY | CE | 325 | -23.55 |
| SELL | CE | 335 | 19.2 |
In the Bull call spread, you need to buy one In the money call option which is 325 and premium paid is 23.55 and sell one out of the money call option which is 335 and premium paid is 19.2.
| Buy Call Payoff | Sell Call Payoff | Bull Call Payoff | |||||||||
| Stock price | 325 CE Buy | 325 CE Prem Paid | 325 CE BUY Net Profit | Stock price | 335 CE Sell | 335 CE prem recvd | 335 Net CE Sell | Stock price | Bull Call Payoff | ||
| 300 | 0 | -23.55 | -23.55 | 300 | 0 | 19.2 | 19.2 | 300 | -4.35 | ||
| 305 | 0 | -23.55 | -23.55 | 305 | 0 | 19.2 | 19.2 | 305 | -4.35 | ||
| 310 | 0 | -23.55 | -23.55 | 310 | 0 | 19.2 | 19.2 | 310 | -4.35 | ||
| 315 | 0 | -23.55 | -23.55 | 315 | 0 | 19.2 | 19.2 | 315 | -4.35 | ||
| 320 | 0 | -23.55 | -23.55 | 320 | 0 | 19.2 | 19.2 | 320 | -4.35 | ||
| 325 | 0 | -23.55 | -23.55 | 325 | 0 | 19.2 | 19.2 | 325 | -4.35 | ||
| 330 | 5 | -23.55 | -18.55 | 330 | 0 | 19.2 | 19.2 | 330 | 0.65 | ||
| 335 | 10 | -23.55 | -13.55 | 335 | 0 | 19.2 | 19.2 | 335 | 5.65 | ||
| 340 | 15 | -23.55 | -8.55 | 340 | -5 | 19.2 | 14.2 | 340 | 5.65 | ||
| 345 | 20 | -23.55 | -3.55 | 345 | -10 | 19.2 | 9.2 | 345 | 5.65 | ||
| 350 | 25 | -23.55 | 1.45 | 350 | -15 | 19.2 | 4.2 | 350 | 5.65 |
By using the above calculation in the table, we can plot the payoff diagram for the bull call spread.
Recommended Brokers
 | No 1 STOCKBROKER IN INDIA Zerodha Free equity & mutual fund investments | Flat ₹20 intraday and F&O trades | Rating ★★★★★ | APPLY NOW |
 | GET FREE DEMAT ACCOUNT Upstox Fix brokerage of Rs. 20 per trade | Rating ★★★★ | APPLY NOW |
 | GET FREE DEMAT ACCOUNT Angel Broking 0 Brokerage on Equity Delivery | Rs 20 per order for Intraday and F&O trades | Rating ★★★★★ | APPLY NOW |











Leave a Reply