Table of Contents
What is Bullish Kicker Candlestick Pattern?
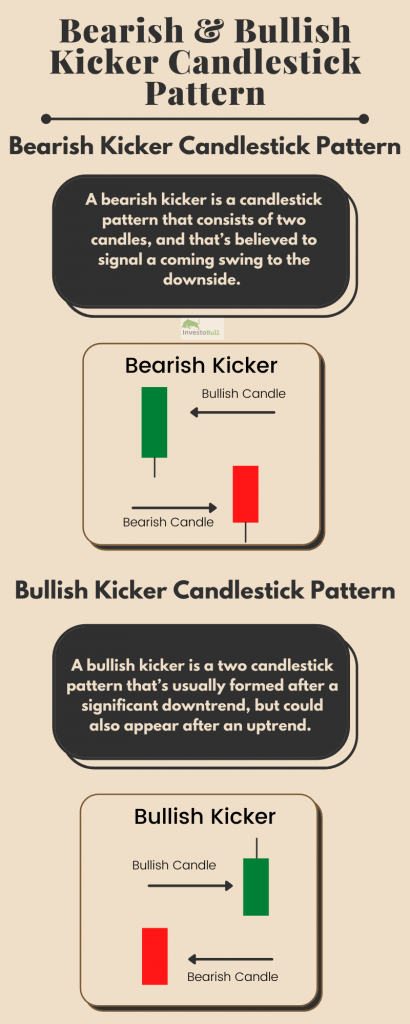
A bullish kicker is a two candlestick pattern that’s usually formed after a significant downtrend, but could also appear after an uptrend.

The bullish kicker consists of a large bullish candlestick, that’s led by a gap to the upside and a bearish candle. Its relevance is magnified when it occurs in overbought or oversold areas.
If you spot a bullish kicker after an uptrend, that could be a sign that the market still has enough strength to continue the uptrend.
How to Identify a Bullish Kicker Candlestick Pattern?
A bullish kicker candle could appear despite the trend and is a strong bullish signal. Here is how you can identify a bullish kicker:
- Firstly, the pattern starts with a bearish (red) candle
- The second candle gaps to the upside, and opens above the previous day’s close.
- It continues straight up and ends as a bullish candlestick.
- The gap should not be filled by the wick of the second candlestick, the candlestick has a tiny or nonexisting lower wick.
How to trade a Bullish Kicker Candlestick Pattern?
When a trader recognizes a Bullish Kicker pattern on a particular stock chart, you can enter into the trade in the next candle after the Bullish kicker pattern emerges. The stop loss should be placed at the low of the previous candle.
What is Bearish Kicker Candlestick Pattern?
A bearish kicker is a candlestick pattern that consists of two candles, and that’s believed to signal a coming swing to the downside.

A bearish kicker can be formed in an uptrend or downtrend and is made up of a bearish candle that’s preceded by a gap to the downside and a bullish candle.
How to Identify a Bearish Kicker Candlestick Pattern
A bearish kicker can develop despite the trend direction and is a strong bearish signal. Here is how you can identify a bearish kicker candlestick pattern.
- The first candle is a bullish (green) candle.
- The second candle gaps up and opens above the high of the first candle.
- The second candlestick continues down and becomes a bearish candle.
- It’s essential that the upper wick of the second candle doesn’t fill the gap.
How to trade using a Bearish Kicker Candlestick Pattern
When a trader identifies a Bearish Kicker pattern on a particular stock chart, you can enter into the trade in the next candle after the Bearish Kicker pattern emerges. The stop loss should be placed at the high of the previous candle.
Bullish & Bearish Kicker criteria
- The first day’s open and the second day’s open are the same.
- The price movement is in the opposite direction from the opening price.
- The trend has no relevance in a kicker situation.
- The signal is usually formed by surprise new before or after market hours.
- The price never retraces into the previous day’s trading range.
Conclusion
The Bullish or Bearish kicker is one of the most successful candlestick patterns and it is believed to lead to a bullish or bearish price run. It is recommended to use other technical indicators such as MACD, RSI, MA, etc to get them accurate. Now, you can check these candlestick patterns using Intradayscreener.com.
FAQs
Recommended Brokers
 | No 1 STOCKBROKER IN INDIA Zerodha Free equity & mutual fund investments | Flat ₹20 intraday and F&O trades | Rating ★★★★★ | APPLY NOW |
 | GET FREE DEMAT ACCOUNT Upstox Fix brokerage of Rs. 20 per trade | Rating ★★★★ | APPLY NOW |
 | GET FREE DEMAT ACCOUNT Angel Broking 0 Brokerage on Equity Delivery | Rs 20 per order for Intraday and F&O trades | Rating ★★★★★ | APPLY NOW |


1 Comment