Table of Contents
What are Candlestick Patterns
The candlestick is used to identify trading patterns. These patterns help the technical analyst to set up a profitable trade.
The patterns are formed by a grouping of two or more candles in a certain sequence. Sometimes powerful trading signals can be identified by just a single candlestick pattern.
The candlesticks can be broken down into single candlestick patterns, double candlestick patterns and also in triple candlestick patterns.
Candles do not have to be set at a specific span of time. They can be set to represent a single day, a whole month, or even as low as a single minute.
What is a candle and how is Candlestick formed
Candlesticks are graphical depictions of price movements for a particular period of time. They are commonly formed by the opening, high, low, and closing prices of a financial instrument.
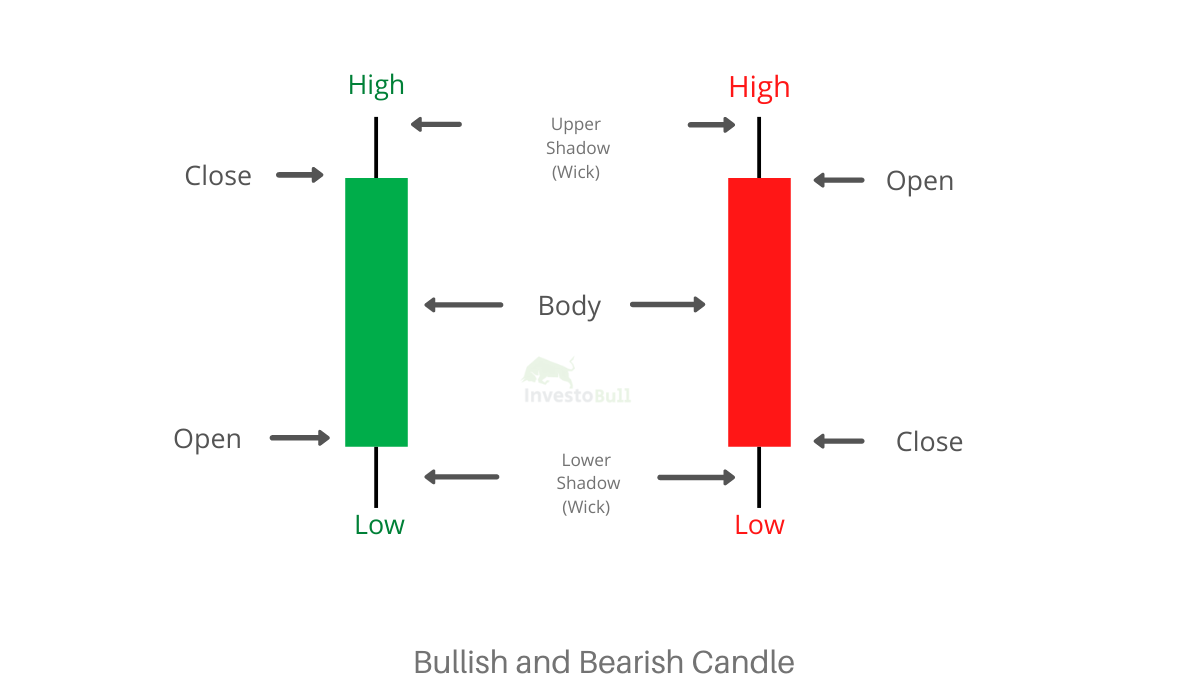
If the opening price is above the closing price then a red or black candlestick is drawn. If the opening price is below the closing price the Green or white candlestick is formed. The length of the candle helps us in understanding the volatility of the day.
If the length of the candle is longer, then the volatile day will be more. And if the candle is shorter, then the volatility day will be less. The candlestick can be said to be a historical indicator as the candlesticks are formed on the previously happened market action.
Types of Candlestick Patterns
Here are the different types of candlestick pattern
Single Candlestick Patterns
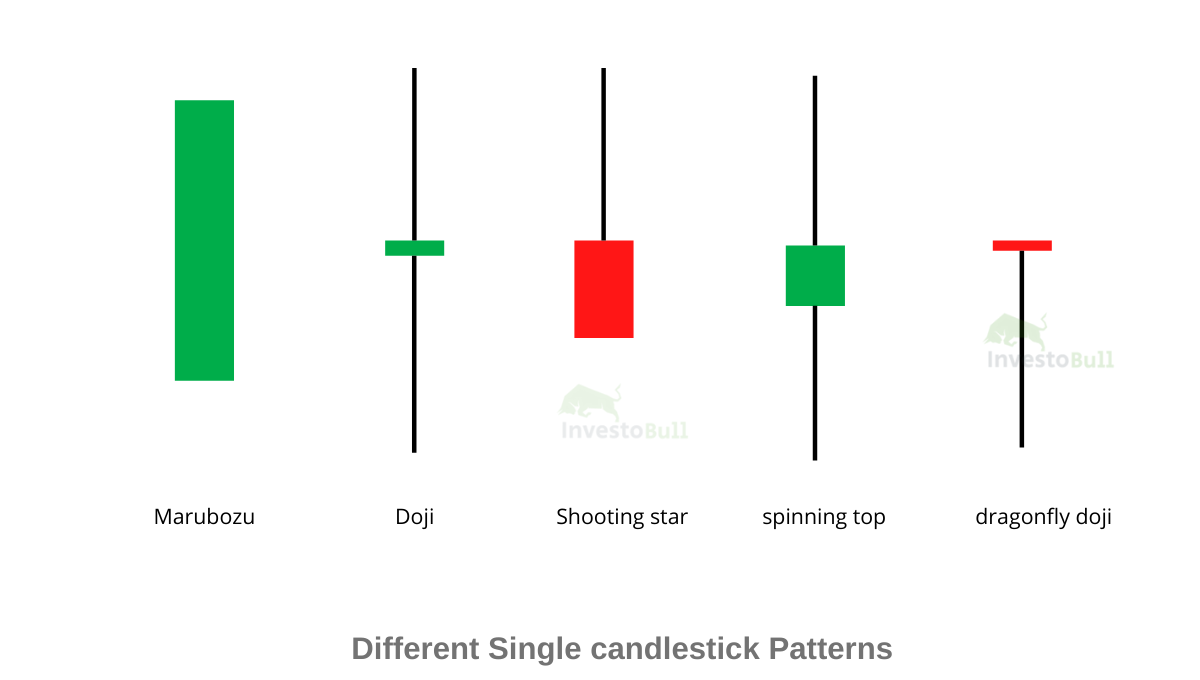
A single candlestick pattern is formed by just one candle. The trading signal is generated based on 1 day’s trading action. The trades based on a single candlestick pattern are not much profitable unless the pattern has been identified and executed correctly. Some of the single candlestick patterns are
- Hammer candlestick pattern
- Inverted Hammer Candlestick Pattern
- Doji Candlestick Pattern
- Bullish Spinning Top Candlestick Pattern
- Hanging Man Candlestick Pattern
- Shooting Star Pattern Candlestick Pattern
- Bearish Spinning top
- Marubozu Candlestick Pattern
Double Candlestick Patterns
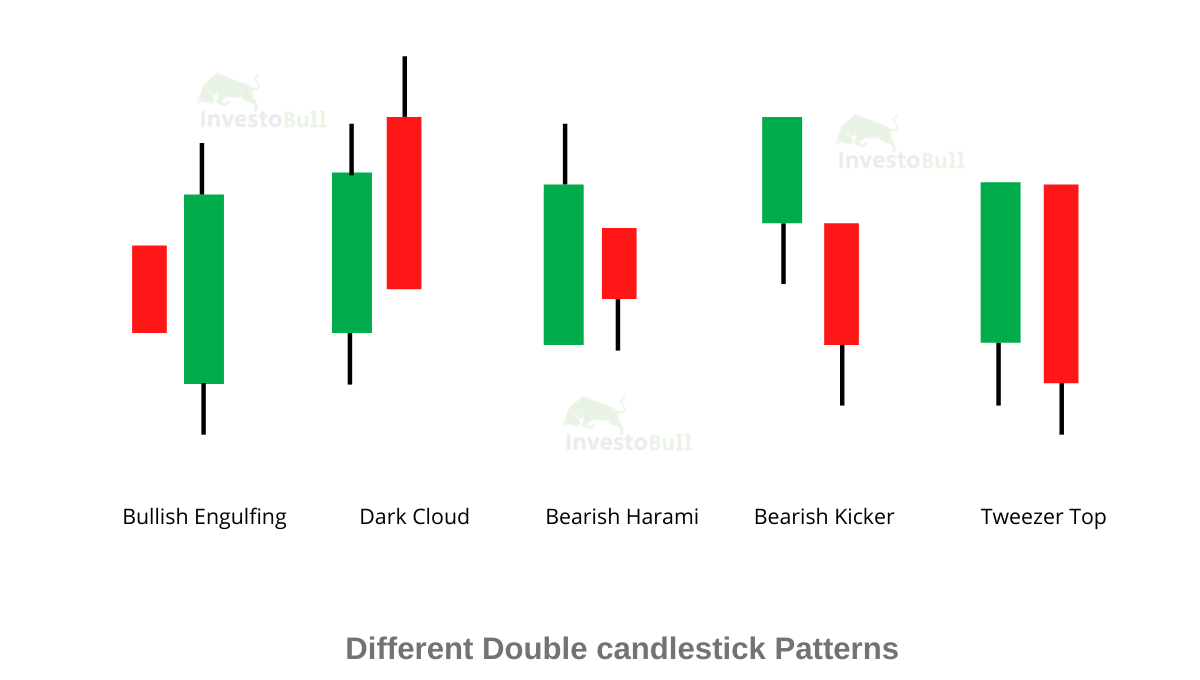
A double candlestick pattern is formed by two candles. The trades based on a double candlestick pattern are the most profitable when the pattern has been identified and executed correctly. Some of the double candlestick patterns are
- Bullish & Bearish Kicker
- Bullish Engulfing Candlestick pattern
- Bearish Engulfing Candlestick pattern
- Bullish & Bearish Harami Candlestick pattern
- Piercing Pattern
- Dark Cloud Cover
- Tweezer Top & Bottom
Triple Candlestick Patterns
A triple candlestick pattern is formed by when three bearish candles follow a strong uptrend or downtrend, indicating that a reversal is going to happen. The second candle’s body should be bigger than the first candle and should close at or very near its low. Some of the triple candlestick Pattern are
- Morning Star & Evening Star
- Bullish & Bearish Abandoned Baby
- Three white soldiers
- Three line strike
- Morning & Evening Doji Star
- Three outside up
- Three Black Crows
Classification of Candlestick Pattern
The candlestick pattern can be classified into three types, they are Bullish candlestick pattern, neutral candlestick Pattern and Bearish Candlestick pattern
Bullish Candlestick Patterns
Bullish candlesticks show the end of a downtrend and signal traders to enter a long position. For bullish patterns, the closing price is higher than the opening price and marked in green colour in the chart.
Position of the formation in the trendline and size of the real-body determine how strong the trend reversal signal is. A long-real body that closes near the high indicates strong price movements where buying forces were strong. To confirm a trend reversal, traders, however, also take into account candlestick formed before the bullish candle appears.
Bearish Candlestick Patterns
Bearish candlesticks appear in an uptrend, indicating a change in market sentiment from buying to selling. Traders prepare to enter a short position when they spot bearish patterns in the uptrend.
Bearish candles form with real-body and upper and lower shadows. Usually, the lower shadow is longer indicating that market has fished for the lower bottom, and selling strengths were strong.
The closing can be below the opening because of strong selling force. Bearish candles are coloured red for easy identification. Like for bullish patterns, traders wait for the bearish reversal pattern to confirm before taking a position
Candlestick Pattern vs Chart Pattern
Candlestick patterns form as a result of stock prices for a specific span of time. Candlestick patterns form over a short time period. Chart patterns form due to the change in prices due to fundamental factors over a long time period.
Related post : Introduction to Chart Patterns – Continuation and reversal patterns
Candlestick patterns show the trend direction for a short time period. The chart patterns indicate the trend direction for a long time period. Chart patterns can also show a change in trend direction. Candlestick patterns are used for short-term entry and exit points. Chart patterns are used for long-term buy and sell signals.
Softwares to find Candlestick Charts online
There are many candlestick chart which helps you to take effective trades in positional and end of day analysis. One of the best tools you can use to find these stocks is using IntradayScreener.com candlestick scans.

This tool can help you find all Candlestick scans End of day for both bullish and bearish scans.
FAQs
Recommended Brokers
 | No 1 STOCKBROKER IN INDIA Zerodha Free equity & mutual fund investments | Flat ₹20 intraday and F&O trades | Rating ★★★★★ | APPLY NOW |
 | GET FREE DEMAT ACCOUNT Upstox Fix brokerage of Rs. 20 per trade | Rating ★★★★ | APPLY NOW |
 | GET FREE DEMAT ACCOUNT Angel Broking 0 Brokerage on Equity Delivery | Rs 20 per order for Intraday and F&O trades | Rating ★★★★★ | APPLY NOW |











Leave a Reply