In technical analysis, chart patterns are one of the most powerful trading tools in their set up as they are based on price movement. Traders use this chart pattern to know whether the market is a favor to them or not.
Table of Contents
What is Chart Pattern?
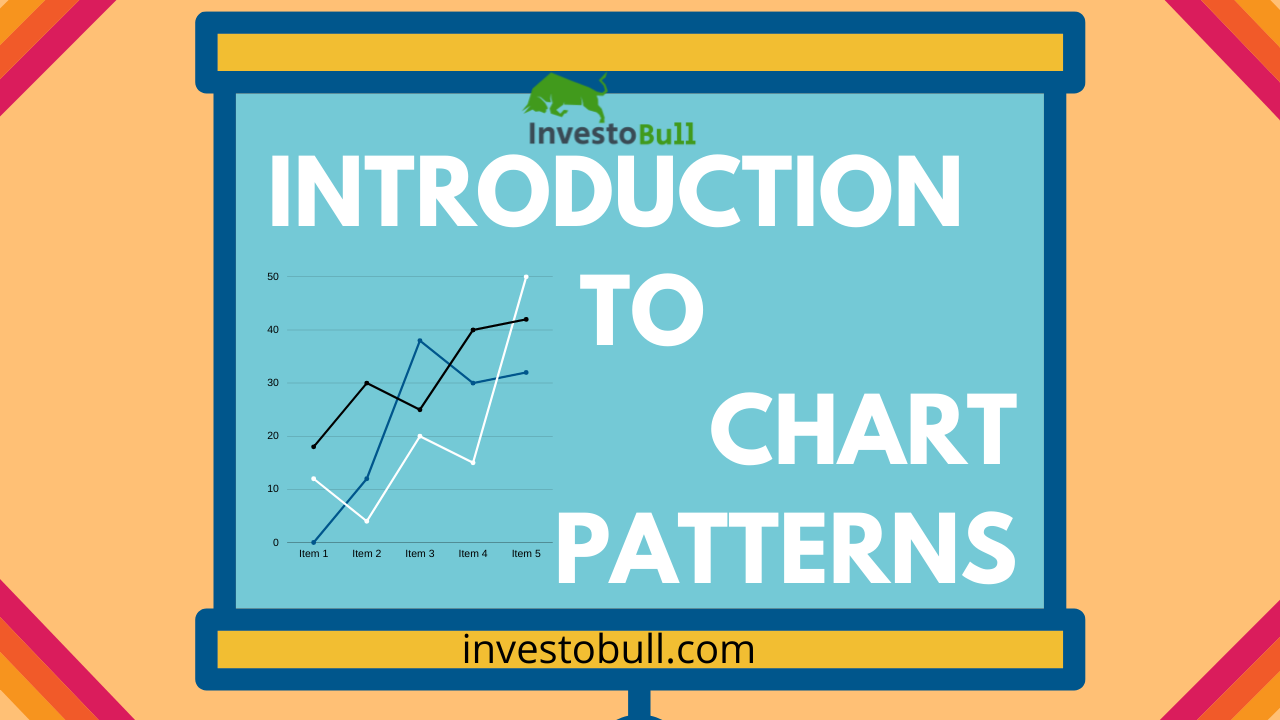
Chart patterns , as the name suggests are patterns formed on charts due to price movement over time. Chart patterns are representation of traders psychology and trading behavior. Chart patterns are certain Shapes or patterns formed due to movement of stock prices
Usually, chart patterns perform an essential role in your experience, and it can provide more profits in the market.
Types of Chart Patterns
There are two broad categories of a chart pattern.
- Reversal Chart Pattern
- Continuation Chart Pattern
Above two types can be further classified into bullish and bearish sub types
- Bullish reversal patterns
- Bearish reversal patterns
- Bullish continuation patterns
- Bearish continuation patterns
These chart patterns can occur in any time frame such as intraday, monthly, weekly, and etc. One of the main reasons for traders to use chart patterns is to find out what the various market shareholders are doing. Just like a doctor that studies the patient’s medical report and concludes the problem of the patient, in the same way, the trader will use chart patterns to know the market movement.
The shareholder’s buying and selling are shown in stock charts. Together they help to build a chart pattern.
We are not going to discuss all the chart patterns on this page because it is an introduction, but let me help you to know what is Continuation Pattern and reversal pattern.
There are two main types of chart patterns that you are likely to know: Reversal, continuation pattern.
What are Reversal patterns?
It’s not complicated to figure out the reversal pattern. It indicates that a market trend will reverse once the pattern is finished. To understand easily, if you recognize a reversal chart pattern when the market moves in an uptrend, it probably implies that the stock price will start moving downwards. If you notice a reversal chart pattern when the market moves in a downtrend, it means that the stock share price will start moving upwards.
Example of a reversal pattern is the triple top Pattern. After an uptrend when triple top is formed, price reverses from there and goes into downtrend


Different types of Reversal Patterns
- Head and Shoulders Pattern
- Inverted Head and Shoulders Pattern
- Double Top Reversal Pattern
- Double Bottom Reversal Pattern
- Falling Wedge Reversal pattern
- Rising Wedge Reversal Pattern
What are Continuation patterns?
Continuation chart patterns indicate that the market trend will be continued once the pattern is finished. These are also called consolidation patterns because they determine how traders take a quick break before moving further in the same path as the previous trend.
Continuation patterns can be bullish as well as bearish. When a continuation pattern (example flag pattern) is formed after an uptrend, it indicates that consolidation is over and not stock is ready to continue its original uptrend. When a continuation pattern (example flag pattern) is formed after a downtrend, it indicates that consolidation is over and not stock is ready to fall further now.

Different Types of Continuation Patterns
- Flag and Pennant
- Symmetrical Triangle
- Ascending Triangle
- Descending Triangle
- Rectangle
- Cup with Handle
Advantages of Chart Patterns
One of the most significant advantages of analyzing chart patterns is that they can usually tell us the possibility of the stock movement (continuation chart pattern or reversal chart pattern). After analyzing chart patterns, traders can know whether a stock is in Bullish move or Bearish move
Since technical analysis is study of past data and how traders reacted at those data point , chart patterns help us study and predict direction of price movement for stocks
Recommended Brokers
 | No 1 STOCKBROKER IN INDIA Zerodha Free equity & mutual fund investments | Flat ₹20 intraday and F&O trades | Rating ★★★★★ | APPLY NOW |
 | GET FREE DEMAT ACCOUNT Upstox Fix brokerage of Rs. 20 per trade | Rating ★★★★ | APPLY NOW |
 | GET FREE DEMAT ACCOUNT Angel Broking 0 Brokerage on Equity Delivery | Rs 20 per order for Intraday and F&O trades | Rating ★★★★★ | APPLY NOW |








How to select stocks for intraday trading investobull please help