Table of Contents
What is Bull put spread strategy?
The bull put spread strategy is applied when the trader assumes that the price of the underlying asset will go upwards slightly. This strategy is also known as the bull put credit spread as a credit is received upon entering the trade.
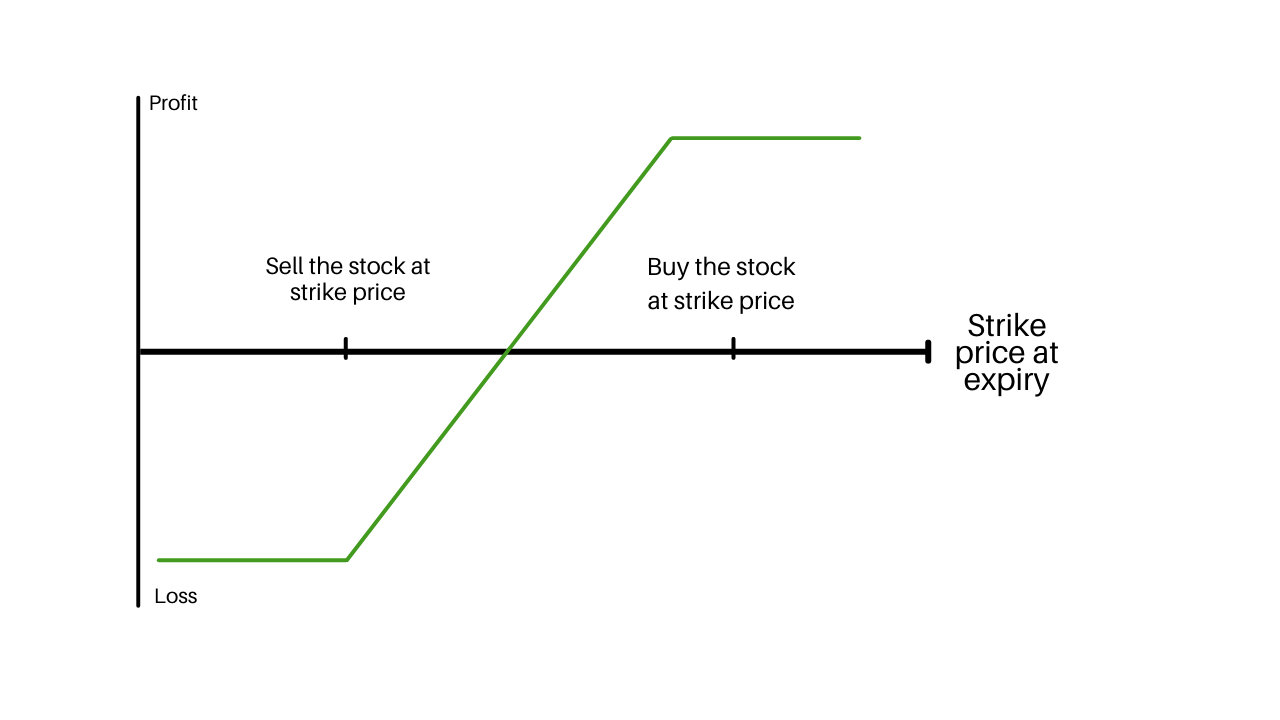
Bull put spreads can be executed by selling a higher strike price in-the-money put option and buying a lower strike price out-of-the-money put option. Both the puts have the same underlying stock and the same expiration date as shown in the graph below.
Related Post: Bear Put Spread – Options trading strategy
Profit in the bull put spread
If the stock price closes above the higher strike price on the expiration date, both options expire without any value and the bull put spread option strategy earns the maximum profit is equal to the credit taken when entering the position.
You can calculate the maximum profits in the bull put spread by using the formula below.
- Maximum Profit in the bull put spread = Net Premium Received – Commissions Paid
- Maximum Profit Gained When Price of Underlying >= Strike Price of Short Put
Related Post: Bull Call Spread – Option trading strategy
Risk in the bull put spread
If the stock price falls below the lower strike price on the expiration date, then the bull put spread strategy acquires a maximum loss equal to the difference between the strike prices of two puts strategies minus the net credit received when putting on the trade.
You can calculate the maximum risk in the bull put spread by using the formula below:
- Maximum Loss in the bull put spread = Strike Price of Short Put – Strike Price of the Long Put -Net Premium Received + Commissions Paid
- Maximum Loss When Price of Underlying <= Strike Price of Long Put
Break-Even Point(s) of the bull put spread
The price at which break-even is obtained for the bull put spread can be calculated using the formula below.
- Break-Even Point of the bull put spread= Strike Price of Short Put – Net Premium Received
The margin requirement is the difference between the strike prices.
How to Make a Bull Put Spread Strategy?
Using Options strategy builder in intradayscreener.com, you can easily build an option strategy for a bull put spread.
Step 1: You just need to select the indices and expiry date and click on add/edit to get started.
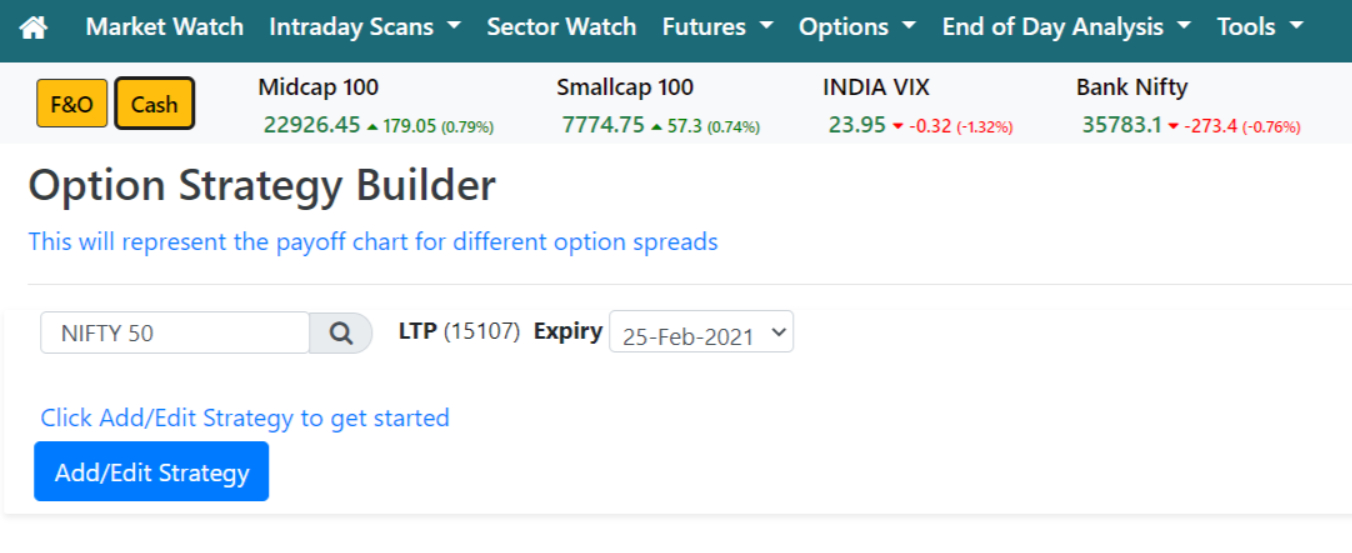
Step 2: Click on the Bull Put Spread strategy below.

Step 3: You will get detailed information on the option strategy like Premium, Max profit at expiry, Max losses at expiry, Breakeven at expiry, and a Bull put spread graph.

Bull Put Spread – Example 1
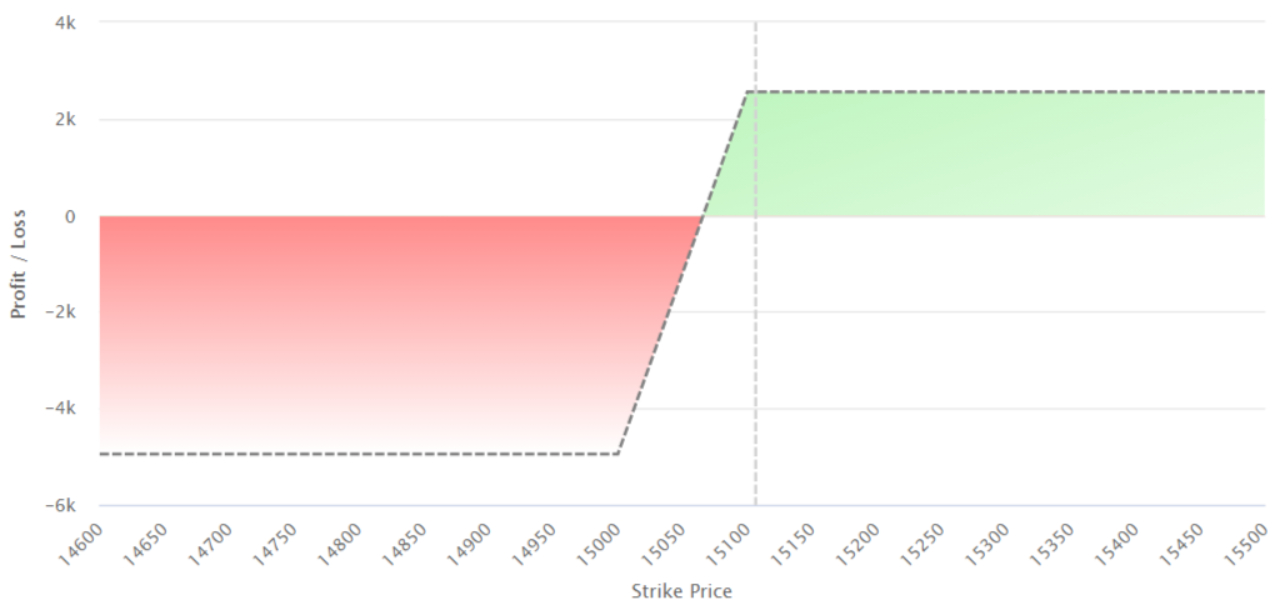
Let us take an example of Nifty50 with the strike price of 15107. A bull put spread consists of one short put with a higher strike price and a long put with a lower strike price.
We buy out-the-money long put which is 15000 and the premium paid is 199.25. We have to sell an in-the-money short put which is 15100 and the premium received is 233.3.

Bull Put Spread – Example 2
Let us take an example of Tata motors with the strike price of 325, buy and sell prices given in the table below
| Action | Type | Strike price | Premium |
| SELL | PE | 325 | 18.25 |
| BUY | PE | 315 | -13.25 |
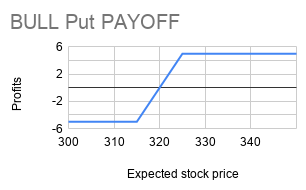
In the Bull put spread, you need to Sell one in the money put option with a higher strike price which is 325, and the premium received is 18.25 and buy an out-the-money put option at a lower strike price which is 315 and the premium paid is 13.25.
| Expected stock price | 325 PE SELL | 325 PE prem recvd | 325 Net PE Sell | 315 PE BUY | 315 PE Prem Paid | 315 Net PE buy | Expected stock price | BULL Put PAYOFF |
| 300 | -25 | 18.25 | -6.75 | 15 | -13.25 | 1.75 | 300 | -5 |
| 305 | -20 | 18.25 | -1.75 | 10 | -13.25 | -3.25 | 305 | -5 |
| 310 | -15 | 18.25 | 3.25 | 5 | -13.25 | -8.25 | 310 | -5 |
| 315 | -10 | 18.25 | 8.25 | 0 | -13.25 | -13.25 | 315 | -5 |
| 320 | -5 | 18.25 | 13.25 | 0 | -13.25 | -13.25 | 320 | 0 |
| 325 | 0 | 18.25 | 18.25 | 0 | -13.25 | -13.25 | 325 | 5 |
| 330 | 0 | 18.25 | 18.25 | 0 | -13.25 | -13.25 | 330 | 5 |
| 335 | 0 | 18.25 | 18.25 | 0 | -13.25 | -13.25 | 335 | 5 |
| 340 | 0 | 18.25 | 18.25 | 0 | -13.25 | -13.25 | 340 | 5 |
| 345 | 0 | 18.25 | 18.25 | 0 | -13.25 | -13.25 | 345 | 5 |
| 350 | 0 | 18.25 | 18.25 | 0 | -13.25 | -13.25 | 350 | 5 |
By using the above calculation in the table, we can plot the payoff diagram for the bull put spread
Recommended Brokers
 | No 1 STOCKBROKER IN INDIA Zerodha Free equity & mutual fund investments | Flat ₹20 intraday and F&O trades | Rating ★★★★★ | APPLY NOW |
 | GET FREE DEMAT ACCOUNT Upstox Fix brokerage of Rs. 20 per trade | Rating ★★★★ | APPLY NOW |
 | GET FREE DEMAT ACCOUNT Angel Broking 0 Brokerage on Equity Delivery | Rs 20 per order for Intraday and F&O trades | Rating ★★★★★ | APPLY NOW |







Leave a Reply