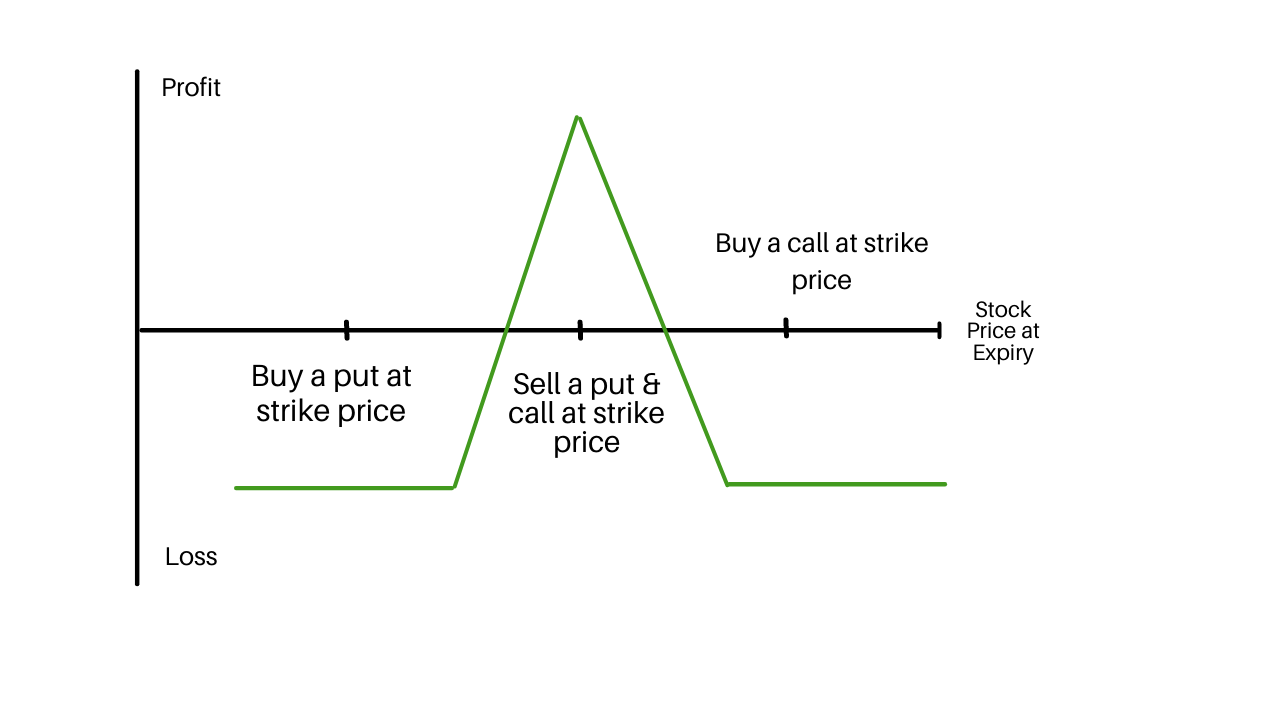
Butterfly Option strategy is a neutral options strategy that has very restricted risk. It involves a combination of various bull spreads and bear spreads.
A holder merges four options contracts having the same expiration date at three strike price points, which can create a perfect price and gain some profit for the holder.

A trader can buy two option contracts, in which one at a higher strike price (Out of the Money Call Option) and another one at a lower strike price (In the Money Put Option) and sells two option contracts at a strike price within (At the Money).
Kindly Observe the Given Example Down Below, to understand more about the concept

The middle strike price is equal to the difference between the high and low strike prices. In the butterfly trading strategy, both Calls and Puts can be used.
Table of Contents
Butterfly Option strategy – Description
It works splendidly when a trader doesn’t assume the security prices to be very volatile in future. The trader can earn a regular amount of profit with very low risk.
The best result of the strategy can be seen when the price of the underlying is equal to the middle strike price. In the butterfly Option strategy, you can either go for Calls or Puts or a combination of both.
You either go for long or short on options or a combination of both depending on what you are anticipating in future.
Limited Profit for a Butterfly Option Strategy
The maximum profit for the butterfly spread is achieved when the underlying stock price settles unchanged at expiration. At the same price, only the lower striking call expires in the money. The maximum profit can be calculated by using the formula given below
- Maximum Profit for butterfly spread = Strike Price of Short Call – Strike Price of Lower Strike Long Call-Net Premium Paid – Commissions Paid
Limited Risk for a Butterfly option strategy
The maximum loss for the butterfly spread is restricted to the primary debit taken to enter the trade plus commissions. The maximum loss occurs when the price of underlying is lesser than or equal to the strike price of lower strike long call. The maximum loss can be calculated by using the formula given below
- Maximum Loss for butterfly spread = Net Premium Paid + Commissions Paid
Break Even Point for a butterfly strategy in options
The break-even points for the butterfly spread position are 2 which are the upper breakeven point and lower breakeven point. The breakeven points can be calculated using the formula given below
- Upper Breakeven Point for butterfly spread = Strike Price of Higher Strike Long Call-Net Premium Paid
- Lower Breakeven Point for butterfly spread = Strike Price of Lower Strike Long Call + Net Premium Paid
The margin requirement is the short call spread requirement or short put spread requirement (whichever is greater).
How to Make an Iron Butterfly Option Strategy?
Using the Options strategy builder in intradayscreener.com, you can easily build an option strategy for the Short Iron Butterfly.
Step 1: You just need to select the indices and expiry date and click on add/edit to get started.

Step 2: Click on the Short Iron Butterfly strategy below.
Step 3: You will get detailed information on the option strategy like Premium, Max profit at expiry, Max losses at expiry, Breakeven at expiry, and a short Iron Butterfly spread graph.

Example
Let us take an example of Tata motors with the strike price of 500, buy and sell prices given in the table below.
| Action | Type | Strike price | Premium |
| BUY | CE | 520 | -9 |
| SELL | CE | 500 | 17 |
| BUY | PE | 480 | -7.05 |
| SELL | PE | 500 | 14.7 |
In the Iron Butterfly strategy, you need to buy one in the money Call option which is 520 and the premium paid is 9. Sell one at the money put option which is 500 and the premium received is 14.7. Sell one at the money call option which is 500 and the premium paid is 17. Buy one over the money put option which is 480 and the premium paid is 7.05.
| Expected stock price | 520 CE BUY | 520 CE Prem Paid | 520 CE Buy Net Profits | 500 CE SELL | 500 CE Prem recvd. | 500 CE Sell Net Profits |
| 475 | 0 | -9 | -9 | 0 | 17 | 17 |
| 480 | 0 | -9 | -9 | 0 | 17 | 17 |
| 485 | 0 | -9 | -9 | 0 | 17 | 17 |
| 490 | 0 | -9 | -9 | 0 | 17 | 17 |
| 495 | 0 | -9 | -9 | 0 | 17 | 17 |
| 500 | 0 | -9 | -9 | 0 | 17 | 17 |
| 505 | 0 | -9 | -9 | -5 | 17 | 12 |
| 510 | 0 | -9 | -9 | -10 | 17 | 7 |
| 515 | 0 | -9 | -9 | -15 | 17 | 2 |
| 520 | 0 | -9 | -9 | -20 | 17 | -3 |
| 525 | 5 | -9 | -4 | -25 | 17 | -8 |
| 480 PE BUY | 480 PE Prem Paid | 480 Net PE buy | 500 PE SELL | 500 PE prem recvd | 500 Net PE Sell | Expected stock price | Iron Butterfly Payoff |
| 5 | -7.05 | -2.05 | -25 | 14.7 | -10.3 | 475 | -4.35 |
| 0 | -7.05 | -7.05 | -20 | 14.7 | -5.3 | 480 | -4.35 |
| 0 | -7.05 | -7.05 | -15 | 14.7 | -0.3 | 485 | 0.65 |
| 0 | -7.05 | -7.05 | -10 | 14.7 | 4.7 | 490 | 5.65 |
| 0 | -7.05 | -7.05 | -5 | 14.7 | 9.7 | 495 | 10.65 |
| 0 | -7.05 | -7.05 | 0 | 14.7 | 14.7 | 500 | 15.65 |
| 0 | -7.05 | -7.05 | 0 | 14.7 | 14.7 | 505 | 10.65 |
| 0 | -7.05 | -7.05 | 0 | 14.7 | 14.7 | 510 | 5.65 |
| 0 | -7.05 | -7.05 | 0 | 14.7 | 14.7 | 515 | 0.65 |
| 0 | -7.05 | -7.05 | 0 | 14.7 | 14.7 | 520 | -4.35 |
| 0 | -7.05 | -7.05 | 0 | 14.7 | 14.7 | 525 | -4.35 |
By using the above calculation in the table, we can plot the payoff diagram for the Iron Butterfly spread.
Conclusion
The butterfly spread strategy can be used only when you’re expecting no volatility in the price of the underlying. The rewards to risk are pretty good when compared to the strategies that are used out of the money options. This provides the butterfly trader to exit these trades earlier in many cases than the out of the money alternative when shooting for almost the same return.


Leave a Reply