Table of Contents
What is Hammer Candlestick Pattern?
A hammer candlestick pattern is a sort of bullish reversal pattern which consists of only one candle and develops after a downtrend in the chart. A hammer has a long lower wick and a short body at the top of the candlestick with almost no upper wick as shown in the image below.
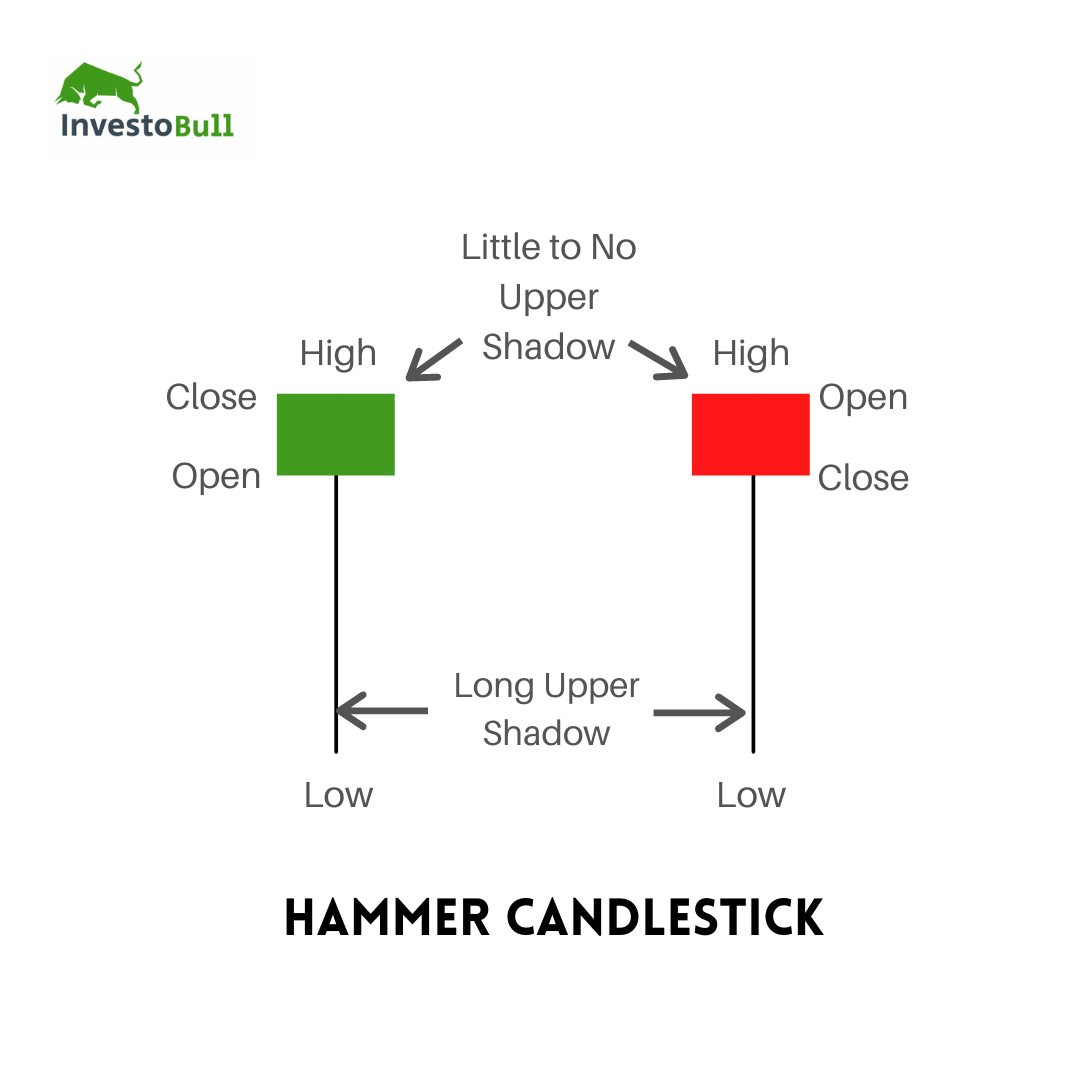
The Hammer candlestick pattern is formed when the open, high, and close are such that the real body is small. You can find a long lower shadow double the length of the real body like a capital ‘T’. The body can be black or red and white or green as shown in the picture above.
Related Post: Introduction to Candlestick Patterns
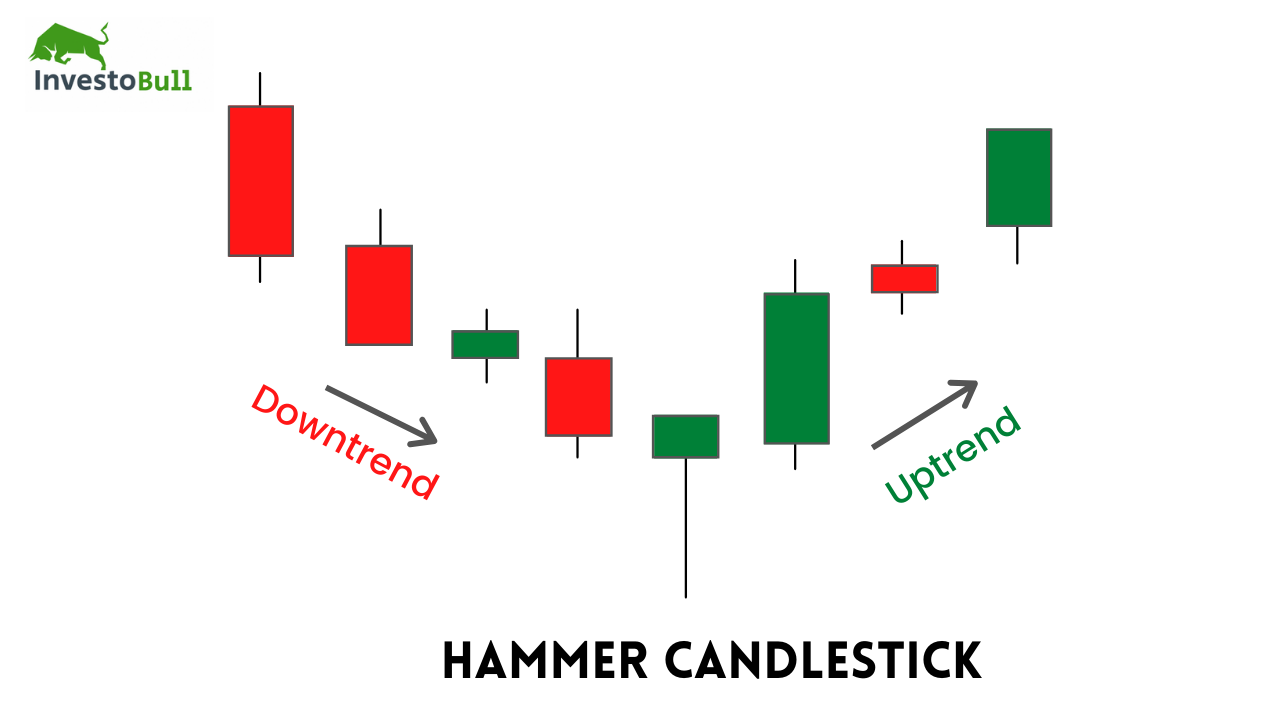
In a chart, if you see the hammer candlestick pattern forming in a downtrend then it is a sign of a high possibility of a reversal in the market as the long lower wick implies a period of trading in which the sellers were initially in charge.
How does a Hammer Pattern work?
Hammer candlestick is formed when a particular stock moves prominently lower than the opening price but demonstrates in the day to close above or close to the opening price. The larger the lower shadow, the more notable the candle becomes.
Hammer candlestick pattern can be found on any particular time frame in the chart. You can see the more comprehensive hammer candlestick as the larger the time frame chart will be, due to the more participants involved.
Below is an image of BPCL stock in the chart, which shows a Hammer reversal pattern after a downtrend.

What is Inverted Hammer Candlestick Pattern?
The inverted hammer candlestick pattern is observed after a downtrend and is usually considered to be a trend reversal signal. The inverted hammer looks like an inverted version of the hammer candlestick pattern, and when it emerges after an uptrend is called a shooting star candlestick pattern.
How does the Inverted Hammer Candlestick pattern work?
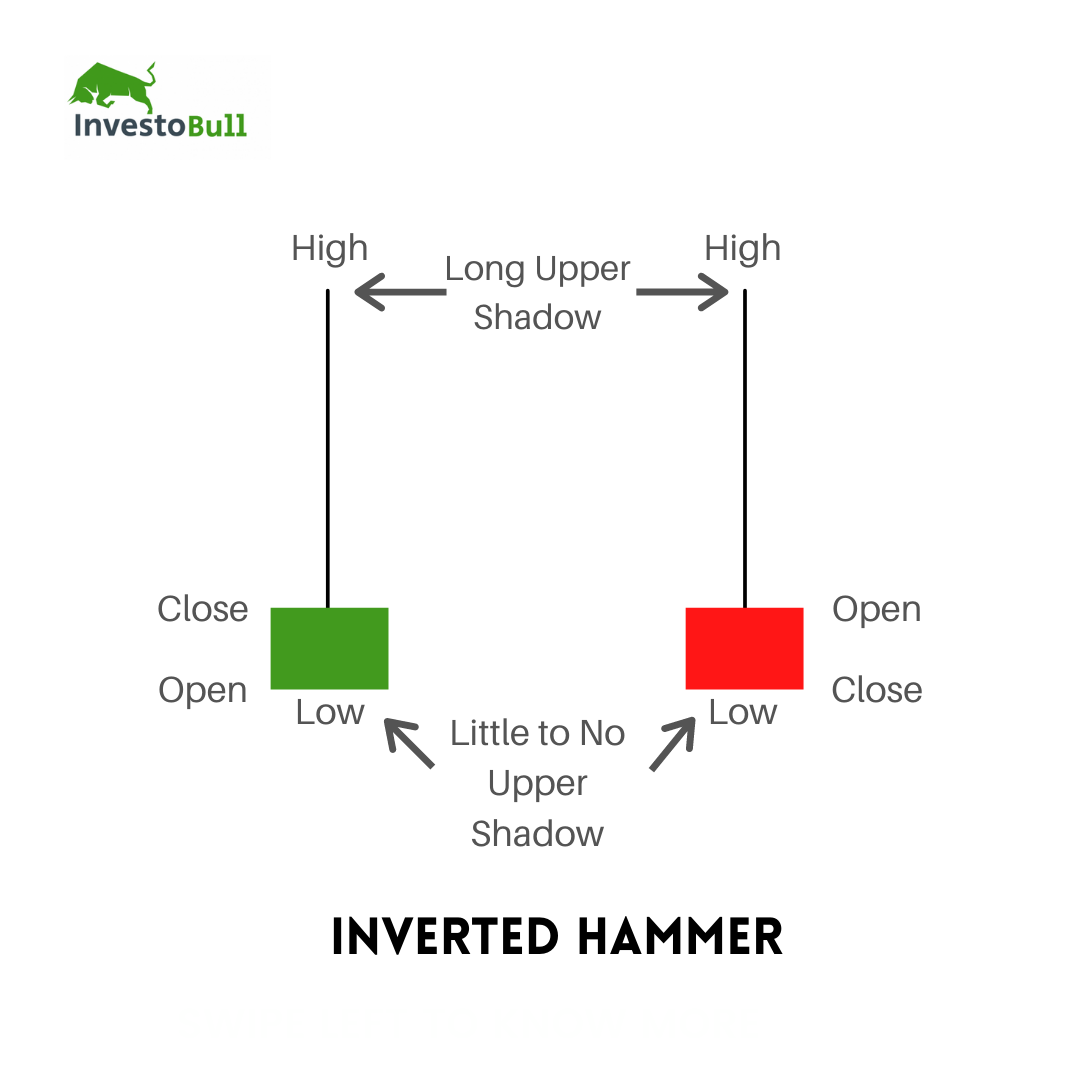
The inverted hammer candlestick pattern is made up of a candle with a small lower body and a long upper wick which is at least double the short lower body.
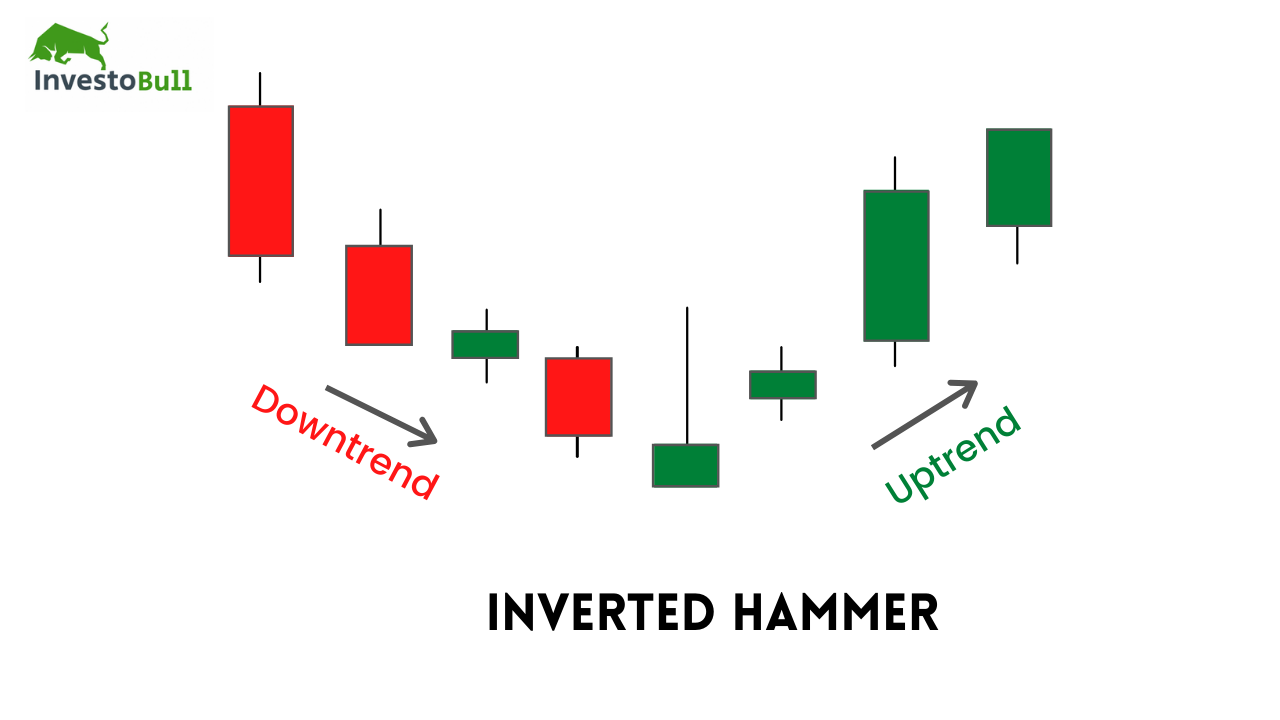
The body of the candle should be at the low end of the trading range and there should be little or no lower wick in the candle as shown in the image below.

The long upper wick of the candlestick pattern shows that the buyers pushed prices up at some point during the period in which the candle was formed, but confronted selling pressure which pushed prices back down to close to where they opened. This can be considered as an initial Bullish sign that some buyer interest may be emerging in stock after the evident downtrend
When facing an inverted hammer, traders usually check for a higher open and close on the next period to confirm it as a bullish signal. Kindly note that we don’t immediately buy when Hammer or Inverted Hammer are formed on charts. We wait for the next bullish close as well.
Pros and Cons of hammer candlestick pattern
Hammer candlestick patterns have their pros and cons so it is advised that traders should never rush into placing a trade as soon as the hammer candle has been identified.
Pros
- The pattern shows the rejection of lower prices. When observed in a downtrend it indicates the end of selling demand and begins to trade sideways or reverse towards the upside.
- Traders that have an existing short position, can view the hammer candlestick pattern as a sign that selling pressure is sinking and giving the ideal time to close out of the short position.
Cons
- The hammer candle does not take the trend into evidence and when considered in isolation there will be a chance that it can provide a false signal.
- In order to enter into high probability trades, it is important for all traders to look for additional information on the chart that supports the case for a reversal.
Conclusion
Both Hammer and inverted hammer are bullish reversal patterns that take place at the end of a downtrend. They provide a signal of an upcoming reversal and a change in the trend direction.
It is recommended to check other technical indicators. These patterns are only measuring the market sentiment and suggesting that a change in the trend direction may take place soon.