The moving average is a trend following indicators like the super trend and MACD. It is based on price movement action. It is easy and simple to use. Moving average indicator is suitable for both short term and long term traders. When you are working with a moving average, you can quickly know the market range.
Moving Average is the close price average of the previous candlestick by which we can find the market moment. The most common application of moving average indicator is to identify the trend direction and to determine support and resistance levels.
Table of Contents
Types of Moving Average?
There are two types of moving average which are
- Simple moving average
- Exponential moving average.
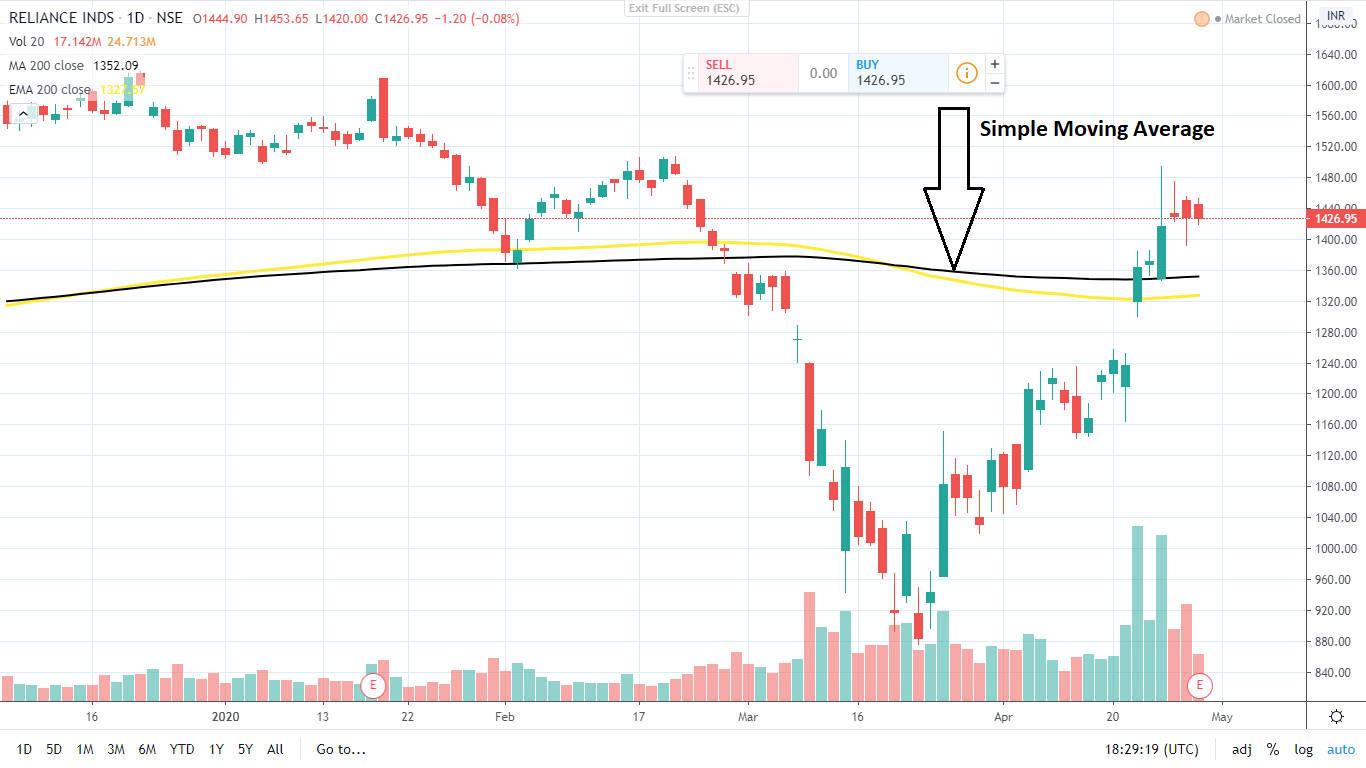
Simple Moving Average
A simple moving average is built by calculating the average price of a security over a specified number of periods. This is the simplest form of a moving average. It is used to determine trend direction. If SMA is moving up, then the trend is up, and if the SMA is stepping down, the trend is moving downwards.
A 200-period SMA is best moving average that is used for predicting the long term trend, whereas 50-bar SMAs are typically used to measure the intermediate direction. Shorter period SMAs can be used to determine shorter-term trends. It is possible to create moving averages from the Open, the High, and the Low data points, and most moving averages are generated using the closing value.
Simple moving averages can be plotted on any timeframe chart. If plotted on 15 minutes chart , 20 period sma means average of closing price of last 20 candles of 15 minutes. Simple moving averages when plotted on Daily Time frame (1 day) are also known as Daily Moving Averages (DMA)

Simple moving average formula
The formula to calculate the simple moving average is by taking a set of prices in the case of financial instruments, which are added together and then divided by the number of prices in the set.
SMA= (A1+A2+A3+…+An)/n
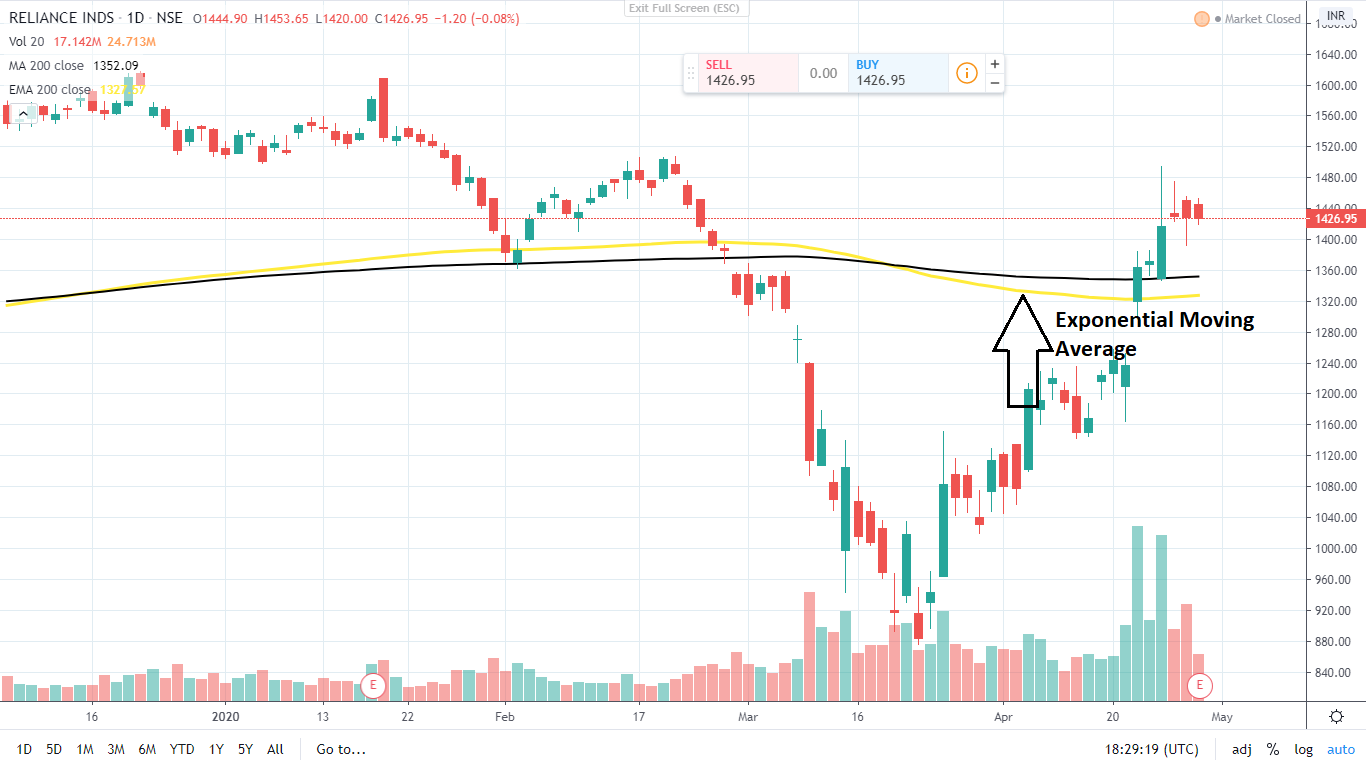
Exponential Moving Average
Exponential moving average is another variation of moving average , where higher weightage is given to near term price movement . Exponential moving averages typically “react faster “ to price changes when compared to simple moving averages . Example a 20 EMA will cross price below when stock falls faster than a 20 day simple moving average.
Exponential Moving Averages can be defined in two ways, which is as a percent-based EMA or as a period-based EMA.
Exponential moving average formula
A percent-based EMA has a percentage as its single parameter, while a period-based EMA has a setting that represents the duration of the EMA. The exponential moving average can be calculated using the formula below
EMA(current) = ( (Price(current) – EMA(previous) ) x Multiplier) + EMA(previous)
For a percentage-based EMA, the “Multiplier” is equal to the EMA’s specified percentage. At the same time, for a period-based EMA, “Multiplier” is similar to 2 / (1 + N), where N is the specified number of periods.
What is the use of Moving Average ?
The primary purpose of Moving average indicator is to estimate the trend of the given stocks. Usually when a stock is trading above its Moving average of n period, its considered as bullish and when it starts trading below its moving average , it’s considered bearish.
Some of the popular moving averages to predict the trend of the stock in the short term are 20 day Exponential Moving average and 13 day simple moving average. Usually when stock trades above its 20 day exponential moving average , it’s considered as being in uptrend in short term . For medium term trends , most traders use a 50 day Simple moving average to find the trend of a stock. Similarly , for longer term trends , traders use 100 day simple moving average and 200 day simple moving averages to determine the long term trend.
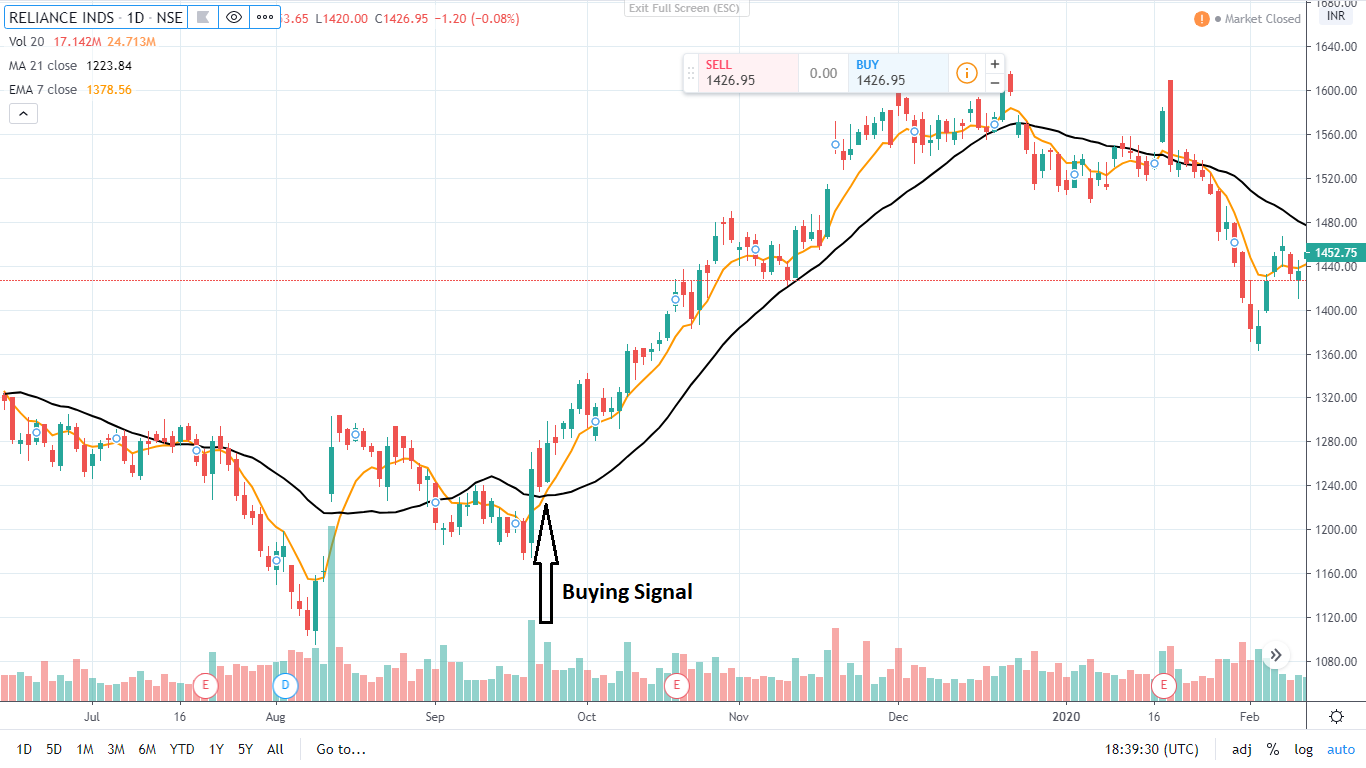
Example you can see in below chart how Reliance is taking supports at 200 day SMA
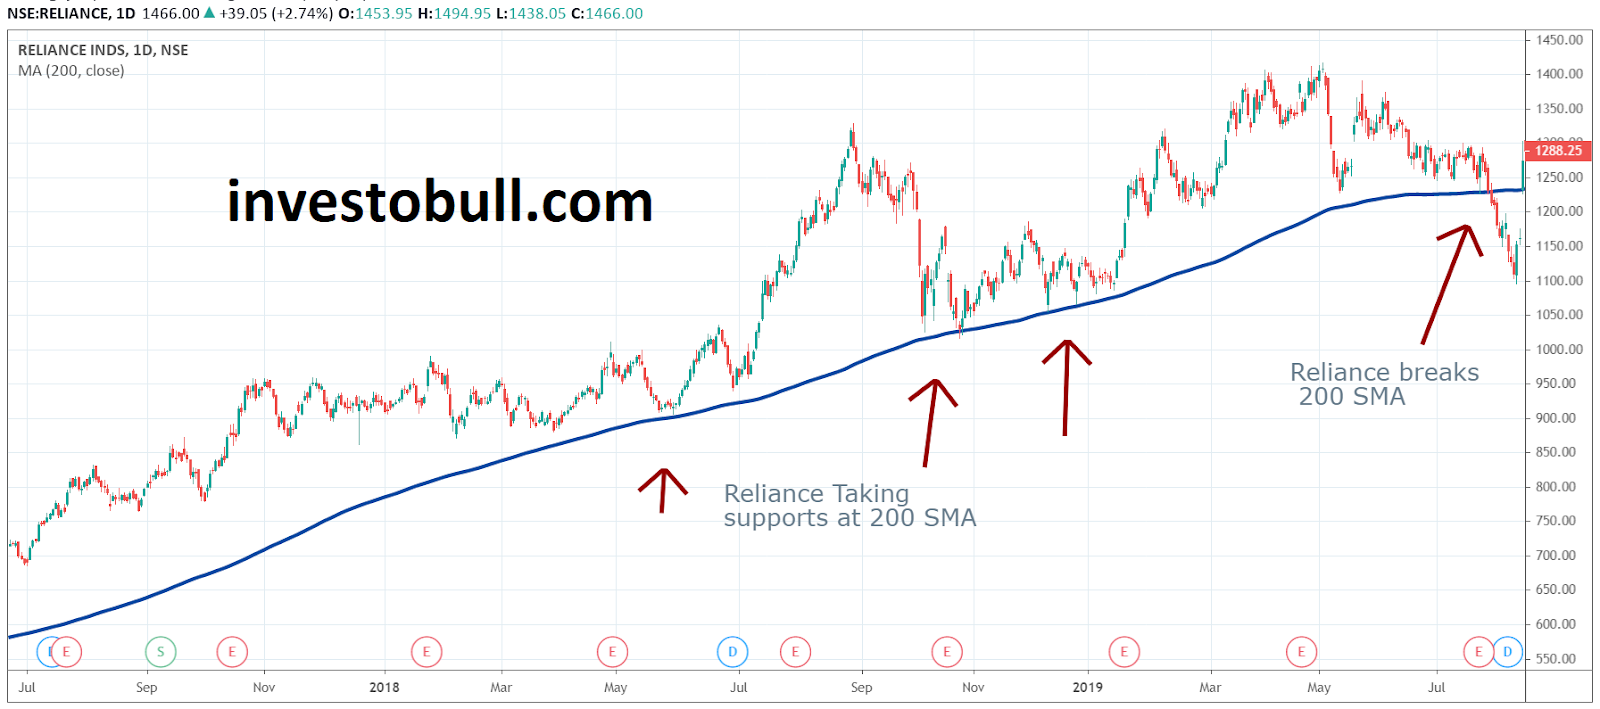
Another question is if all stocks take support at 200 sma ? Well the answer is no!
Though most of the stocks take support at 200 day SMA , however there may be some stocks that might be taking support of 100 SMA often. To be sure, you need to plot all the common averages on the chart and see at which moving average a particular stock is taking support.
You can find list of stocks crossing important moving averages on upside or downside and then use it for taking trades. Moving averages breakout screener helps you find stocks automatically.
Moving Averages as Support and Resistance
Support is the level at which demand is higher than supply to restrict the stock from sliding further. There will be more buyers than sellers on the share price you expect. Resistance is the level at which supply is more than demand to restrict the stock from moving upwards. There will be more sellers than buyers on the share price you expect.
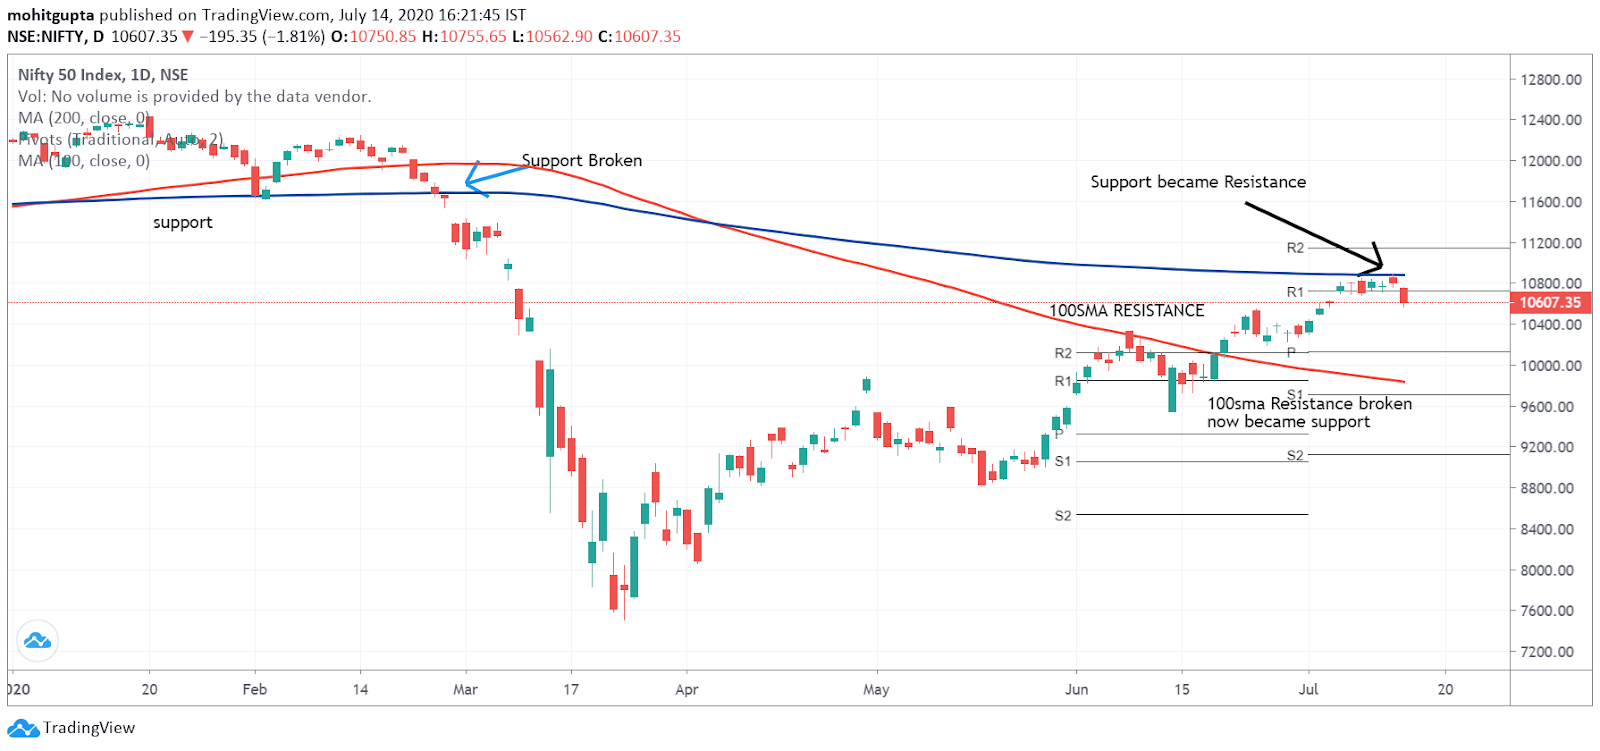
You can check the chart of Nifty 50 in the below image, in which the 200 DMA becomes resistance and 100 DMA is Support.
How to Use Moving Averages for Trading
Now since we know Moving averages are used to predict the trend of stock , we can use it for trading in two major ways
1> To buy or sell stocks when price goes above or below the moving average which acts as Support or resistance
2> To buy or sell the stock using Crossover Strategies
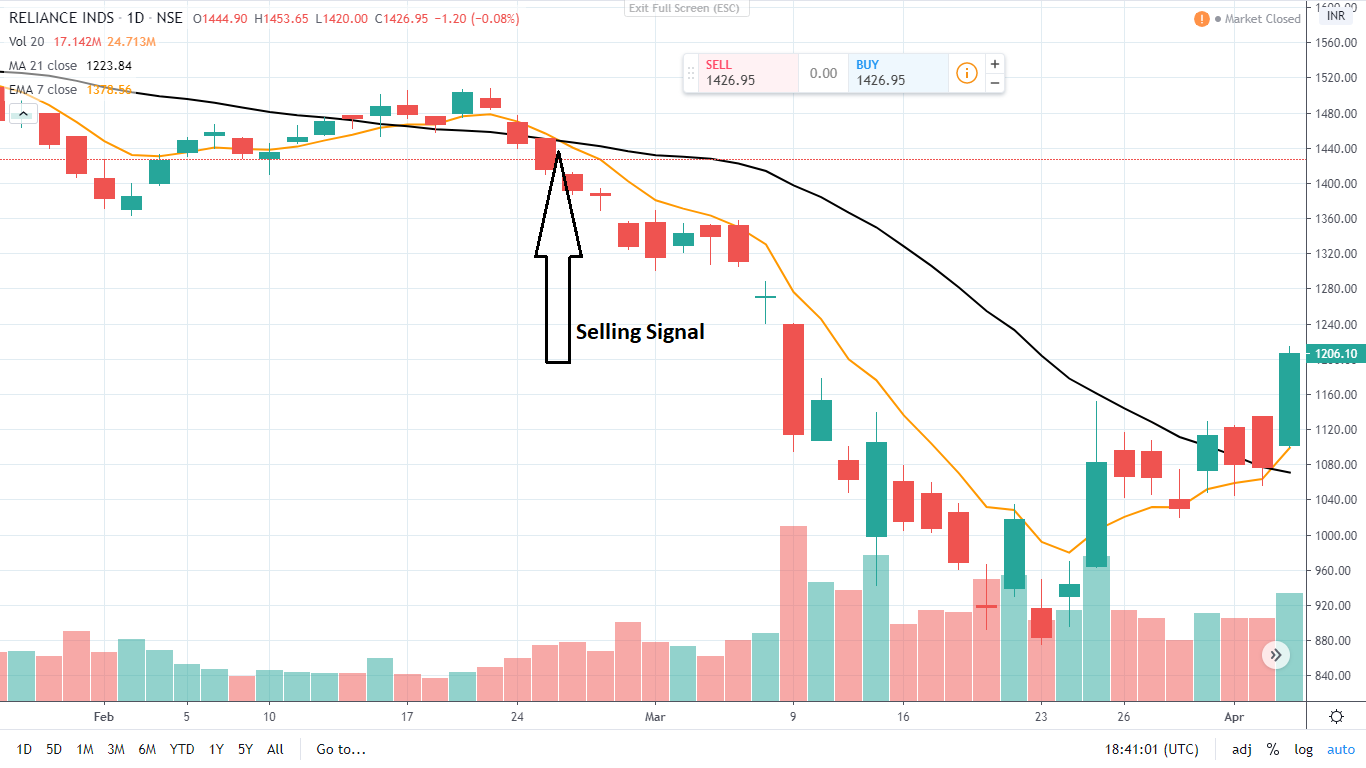
A very basic example using the above chart of reliance can be , when the Reliance stock broke 200 Day moving average and closed below it , we could have shorted it there with 5% stop loss above 200 Day moving average.
Another popular intraday strategy using Moving average trading strategy are crossover Strategies. In this strategy , we use a small moving average to predict a small term trend and a larger moving average to predict a bigger time trend. Short term moving averages move faster with short term trends and signal any change in trend faster than longer period moving average. When the shorter term moving average crosses a larger time period moving average , we can say a change in trend is occurring and we can buy or sell stocks then. Let’s take a deeper look on crossover strategies now.
Moving Average Crossover Strategies
The crossovers are one of the leading moving average strategies. The first type is a price crossover, which is when the price crosses above or below a moving average to signal a possible change in trend.
Another strategy is to apply two moving averages to a chart in which one is longer, and another one is shorter. When the shorter moving average crosses above the longer moving average, then it is recorded as a buy signal as it indicates that the trend is moving up.
When the shorter moving average crosses below the longer moving average, then it is considered as a sell signal, as it indicates that the trend is shifting down.
Which is the best moving average for Intraday trading
Well, to be very blunt , there is no answer for which is the best moving average for intraday trading. Intraday trading involves trading in lower timeframes of 15 minutes and 5 minutes mostly. For different stocks, different moving averages seems to be working best depending on which traders are active in that counter and their Algo’s how they are buying and selling. Usually 20 period exponential moving average is something that works in most of heavily traded stocks and indices.
Best way to find out is by self observation. Open charts and see which moving averages are working as SR levels for that stock. Also you can back test efficiency of a trading strategy with different moving average to see which one performs better.

Advantages of using Moving Average?
Here are the advantages of using a moving average.
- Moving average indicator is an easy and simple tool to use. It helps to predict the market trend by using a simple crossover method.
- Most of the beginners and intermediates use it to understand the market trend.
- A moving average analyzes price data by smoothing it out and building one flowing line.
- The moving average can function not only as an indicator on its own but also forms the very basis of several others.
The disadvantages of using Moving Average?
Here are the Disadvantages of moving average
- The Moving averages are calculated on the basis of the historical data, and nothing about the calculation is predictive.
- In the period of flat markets, when prices fluctuate in a particular price range, the moving average does not work.
Conclusion
Moving averages are a popular and simple strategy for both entry and exit. Moving averages are trend-following indicators that will always be a step behind. Moving averages can also highlight the areas of possible support or resistance, which helps a trader to predict the market.
Which is the best moving average indicator to use
There is no best moving average indicator. It depends on your strategy and time frame you are trading. Usually 20 EMA is most widely usedmoving average across all timeframes
What is Golden cross and Death cross
A golden cross occurs when a faster-moving average crosses a slower moving average from below to above. Usually 50 period SMA and 200 period SMA is used for golden cross on a daily timeframe chart.
A death cross occurs when a faster-moving average crosses a slower moving average on downwards. Usually 50 period SMA and 200 period SMA is used for death cross on a daily timeframe chart
Is moving average a good indicator ?
Yes, The moving average is the best indicator used in trading. It is best for trend following system. Most of the traders use moving averages to find trend of stocks on daily timeframe. Stocks trading above 100, 200 and 50 DMA are considered to be in uptrend
Which is better SMA or EMA
SMA and EMA are calculated differently .While exponential moving average calculation reacts faster, and the SMA reacts slower. . Many traders use EMAs because they want to be informed when the stock price moves in different way.
Which ever stock you are planning to trade, check if in past price has reacted well to SMA or EMA and you will see the real answer!
Which is most popular moving averages
For long-term support and resistance levels, the 50 day, 100 day and 200-day moving averages are the most popular moving average indicators.
What is EMA trading strategy
An exponential moving average strategy is used to recognize the market trend. It can also give the support and resistance level to complete your trade. Usually 20 ema is used to determine short term trend and 100 EMA to determine long term trend
Recommended Brokers
 | No 1 STOCKBROKER IN INDIA Zerodha Free equity & mutual fund investments | Flat ₹20 intraday and F&O trades | Rating ★★★★★ | APPLY NOW |
 | GET FREE DEMAT ACCOUNT Upstox Fix brokerage of Rs. 20 per trade | Rating ★★★★ | APPLY NOW |
 | GET FREE DEMAT ACCOUNT Angel Broking 0 Brokerage on Equity Delivery | Rs 20 per order for Intraday and F&O trades | Rating ★★★★★ | APPLY NOW |