Before entering the share market world, it is necessary to know Nifty and Sensex. Nifty is a Stock market index of NSE, and Sensex is a stock market index of BSE. The full form of NSE is the National Stock ...
In India, the Pharmaceutical industry is one of the best growing sectors in the global market. In this article, we will discuss in detail about the top Pharma companies in Indian stock market As of now, India is the biggest ...
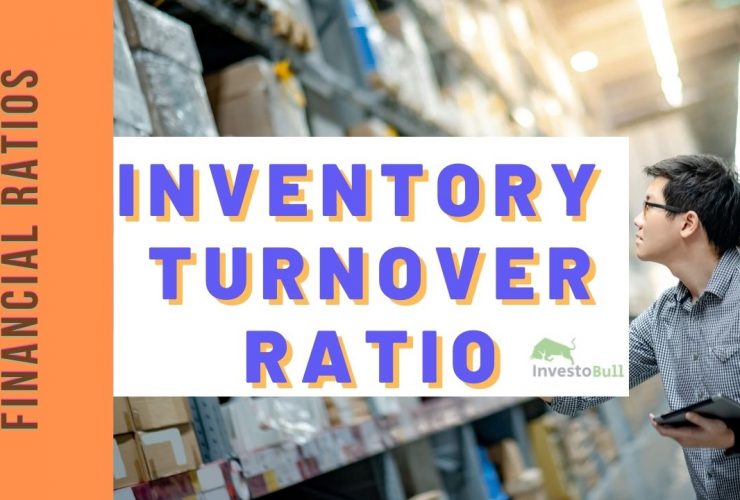
What is Inventory Turnover Ratio Inventory turnover is a ratio that measures the number of times inventory is sold or ‘turned’ in a given time period. A higher inventory turnover ratio is preferable and indicates the ability of a company ...
Volume profile indicator is an indicator that shows volume of stocks or underlying traded at different price levels over a period of time. Volume profile indicator shows this data as a histogram in a Y-axis (vertical) usually next to price ...
In this blog, we will provide you a detailed list of the top FMCG companies in India. But before that, let us know what FMCG means. What is FMCG The full form of FMCG is Fast-moving consumer goods. FMCG are ...
What is a Bearish Engulfing Pattern? A bearish engulfing pattern happens in the candlestick chart of stocks when a large red candlestick fully engulfs the small green candlestick. This pattern usually happens during an uptrend and is supposed to signal ...
Both National Stock Exchange and Bombay Stock Exchange are the leading stock exchanges in India. The BSE and NSE trading time in India is 9:00 AM to 3:30 PM. Both of them are open on the weekdays from Monday to ...
Swing trading is a short term trading method that can be used to trade stocks and derivatives. In swing trading, positions are held for a duration of 2 days to a few weeks depending on the preference of the trader. ...
A rectangle chart pattern is a continuation chart pattern. It is a part of technical analysis. We already know that continuation chart patterns specify the current trend will continue for a particular time. In this article you can know what ...
The main components in technical analysis are chart patterns. Flag pattern is one of the chart patterns used by traders.Traders use these chart patterns for potential price movement in the market. Usually, chart patterns can be categorized into two types ...








Find Us on Socials