Table of Contents
What is Inventory Turnover Ratio
Inventory turnover is a ratio that measures the number of times inventory is sold or ‘turned’ in a given time period. A higher inventory turnover ratio is preferable and indicates the ability of a company to sell its products fast!
Lets understand in detail about Inventory Turnover Ratio and how to use it to analyse stocks. Inventory Turnover Ratio is a fundamental ratio which tells you how efficiently the company is managing its inventory to convert it into sales.
Inventory means the collection of all raw materials and goods the company has for sales. It is one of the major assets of a company. So the proper inventory management is a key process and has a significant financial impact on the company. Inventory management covers different stages from raw material purchase, then the storage of raw materials/finished goods to the selling of finished products. If the company is not able to streamline its inventory management in an efficient manner then it will definitely impact its financial condition.

Inventory management example.
Suppose a company ABC is in the business of rice producing, processing and exporting. So the business involves producing or buying the rice for an entire year in a short period of October to December. Then storing that rice for the entire year to be supplied. This involves a high storage cost. If the company is not able to sell those inventory in a short period of time, then the cost involved to maintain and storage will increase which is called Work In Capital cost.
In short, a company has to keep clearing/selling its stocks in a short period of time to get the cash and keep the inventory storage cost under control.
Formula to calculate Inventory Turnover Ratio
Inventory Turnover Ratio = Total Sales / Average Inventory
where average inventory = (inventory at start of year+ inventory at end of year)/2
Sometimes instead of Total Sales, Cost of Goods Sold is taken into consideration for calculating the ratio. The higher value of inventory turnover ratio indicates the better efficiency of the company to convert its inventory to sales. While a lower value indicates that the company takes a long time to sell finished products from its raw material.
But this ratio differs from industry to industry. So it is better to always compare companies of the same industry for ratio comparison.
So if a company makes a sale of Rs 100 and the average inventory cost is Rs 25, then the inventory turnover ratio = Rs 100/ Rs 5 = 4.
It shows the company can rotate its inventory 4 times a year or it takes 3 months for the company to sell the finished products from its raw material.
This brings us to another ratio which is very much related. That is Days Inventory Outstanding or Days of Inventory.
Days Inventory Outstanding
Days inventory outstanding is the total number of days for which company holds its inventory before selling it . If an efficiency ratio which is used in analysis of working capital management. Lower days inventory outstanding is preferable , so that cash is not tied up in inventory for long and stock does not become obsolete.
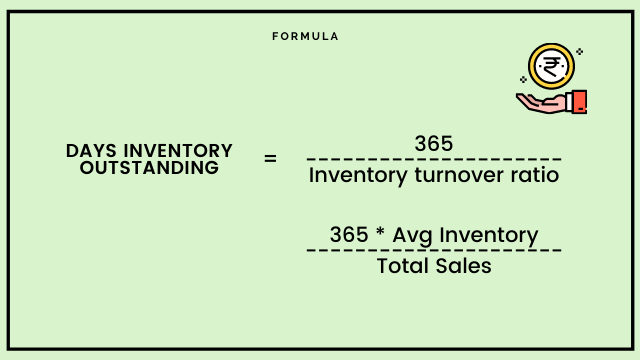
From the above example, Days Inventory outstanding comes as 365 / 4 = 91 days, which indicates that the company has to keep the inventory of 91 days of sales at any point of time to keep the business running. That 91 days stock involves some cost which will be considered as Working capital cost. If somehow a company is able to improve on DIO year on year through some efficient framework or model, then it can free up the money involved to be used elsewhere.
So as an investor, you have to track which companies are reducing their DIO or increasing the inventory turnover ratio year on year.
How to use Inventory Turnover Ratio in Stock Analysis
So now we will understand what are the ways we can use this ratio in fundamental analysis of a company.
- By comparing with peers on the absolute value – An investor can compare the inventory turnover ratio of different companies in the same industry and see which one has the better value. If a company has higher value than its peers in the same industry, that means it is using its inventory efficiently than others. But here one thing to check is whether the ratio is higher due to a temporary reason and for a short time. If it is a temporary change it should be ignored. Like a company has managed to do a bigger sale for a particular quarter but it is not sustainable then its not of much use to the investor.
- By Analysing the trend of ratio year on year – While doing the analysis of a company, you can see the trend of inventory turnover ratio to understand how the company is doing in terms of its operations efficiency. If the decisions made by the company in day to day working are working in its favour.
If the inventory turnover ratio is improving year on year, then it reflects that the company is getting efficient in its operations and inventory management and will create value for its shareholders through this optimization. But if its declining then it reflects the inefficiency in the management which can be seen as a threat to the shareholders expected return.

Inventory turnover analysis for different Sectors
While doing analysis based on inventory turnover ratio, you have to understand that it varies drastically from industry to industry because of their different business model. Some industry demands for huge inventory costs while others are not. So when you compare companies to find out which is doing better, pick companies with the same sector.
For example – the industries like Agriculture production crops, Apparels and finished products from fabrics, chemicals and its end products are inventory intensive and they have to maintain their inventory for a longer period, so inventory turnover ratio is less. As explained with the rice company example which comes under Agriculture crop production, they have to spend a lot of money on inventory storage and are mostly able to sell their inventory 2 to 3 times in a year. Mostly the companies which have such lower ratios are prone to debt burden in some unexpected bad economic times.
Another example is FMCG(Fast moving consumer goods) which is also an inventory intensive sector but the inventory is fast moving. It means they don’t have to store the inventory for a longer period and are able to convert it to sales frequently, maybe 4-5 times in a year.
For the IT industry, the inventory turnover ratio is not a relevant ratio for analysis as they dont maintain any inventory and deal with software development.
Recommended Brokers
 | No 1 STOCKBROKER IN INDIA Zerodha Free equity & mutual fund investments | Flat ₹20 intraday and F&O trades | Rating ★★★★★ | APPLY NOW |
 | GET FREE DEMAT ACCOUNT Upstox Fix brokerage of Rs. 20 per trade | Rating ★★★★ | APPLY NOW |
 | GET FREE DEMAT ACCOUNT Angel Broking 0 Brokerage on Equity Delivery | Rs 20 per order for Intraday and F&O trades | Rating ★★★★★ | APPLY NOW |