CPR indicator is one of the familiar Intraday trading Indicators used by technical analysts. The CPR full form in trading is Central Pivot Range.
Analyzing charts is one of the most vital factors in every trade. There are a number of procedures and different types of indicators available for the technical analysis, which also includes the Central Pivot Range.
Pivot points have been an efficient indicator for a long time. Apart from pivot points, one kind of pivot point, that is currently much used is the central pivot range or the CPR indicator. The CPR is an extension of the pivot point.
Table of Contents
What is Central Pivot Range (CPR)?
The central pivot range (CPR) is the most prominent technical indicators for traders on price. CPR is mostly to identify the stock price movements by indicating crucial price points.
The traders largely use it for intraday trading. CPR indicator provides a range that includes 3 different levels, which are
- the pivot point,
- The top central pivot point, and
- Bottom central pivot point.
Central Pivot Range Formula
The Central pivot range formula is as follows,
- Pivot point= (High + Low + Close)/ 3
- Bottom central pivot point (BC)= (High + Low)/ 2
- Top central pivot point= (Pivot – BC) + Pivot
In the CPR formula, the High, Low, and Close refer to the previous day’s highest, lowest, and closing price of the stock respectively.
As per this CPR calculation, the highest value is frequently the TC(Top central pivot point) value and the lowest value will be BC (Bottom central pivot point).
How Central Pivot Range (CPR) works?
CPR or Central Pivot Range is the technical analysis indicator that helps us to estimate the following methods for trading.
- The CPR lines indicate a bullish view if they constantly move upward and the price remains higher than the Top central value.
- If the CPR lines depict an overall downward movement and the price remain lower than the Bottom central value, then it refers to the bearish view of the trade.
- The width of CPR, in which the distance between the Top central and Bottom central line in the chart helps in determining the price movements.
- The larger CPR width is the result of the previous trending market usually denotes a sideways trend for the next day.
- The narrow trend of the previous day makes the CPR width narrower, which would further indicate a trending market.
CPR Breakouts
CPR breakouts are helpful in trading as it indicates the chance of continuing with the existing movements. In a candlestick pattern, the bigger breakout candles provide additional assurance for the continuing trend.
If a stock breaks out the TC line and forms any of the bullish candles (bullish engulfing, bullish harami & Morning star) it resembles that the stock will go further higher.
If a stock breaks down the BC line and forms any of the bearish candles (bearish engulfing, bearish harami & Evening star) it resembles that the stock will go further down.
Experts suggest that this additional volume assurance provided by the CPR breakout can increase the success rate to approximately 70%.
Virgin CPR
When the price movements do not touch any of the CPR levels in a particular schedule, then that particular CPR is the virgin CPR.
Traders can take the virgin CPR of the previous schedule to act as the support or resistance of the next day, as the prices may move in the opposite direction on touching these support and resistance levels.
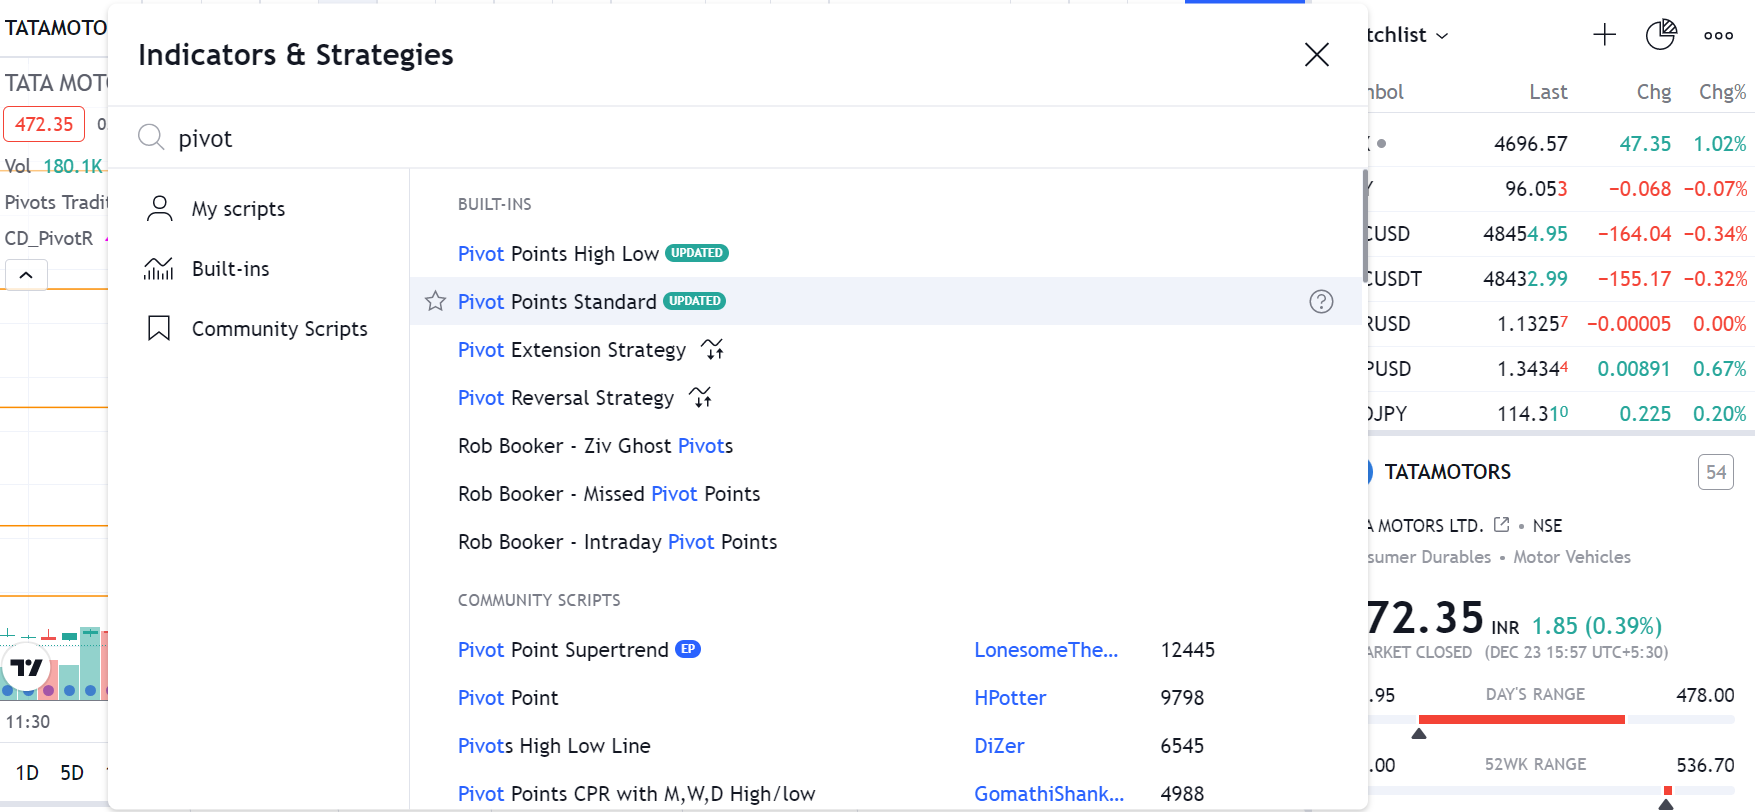
How to add CPR in charts
Most of the modern trading and charting platforms have CPR built-in by default. You need to simply go to the indicators section and select Pivot Range Pivot Boss and it will be plotted.

It is recommended to add Pivot points indicator along with Pivot Range Pivot Boss to know the target price.
How to trade using CPR or Central Pivot Range?
To trade using the CPR indicator, you need to look at whether the stock has a bullish view or a bearish view.
CPR Bullish View
If the stock is showing a bullish view that is when the market price of the stock move higher (breakout) than the TC level in CPR.
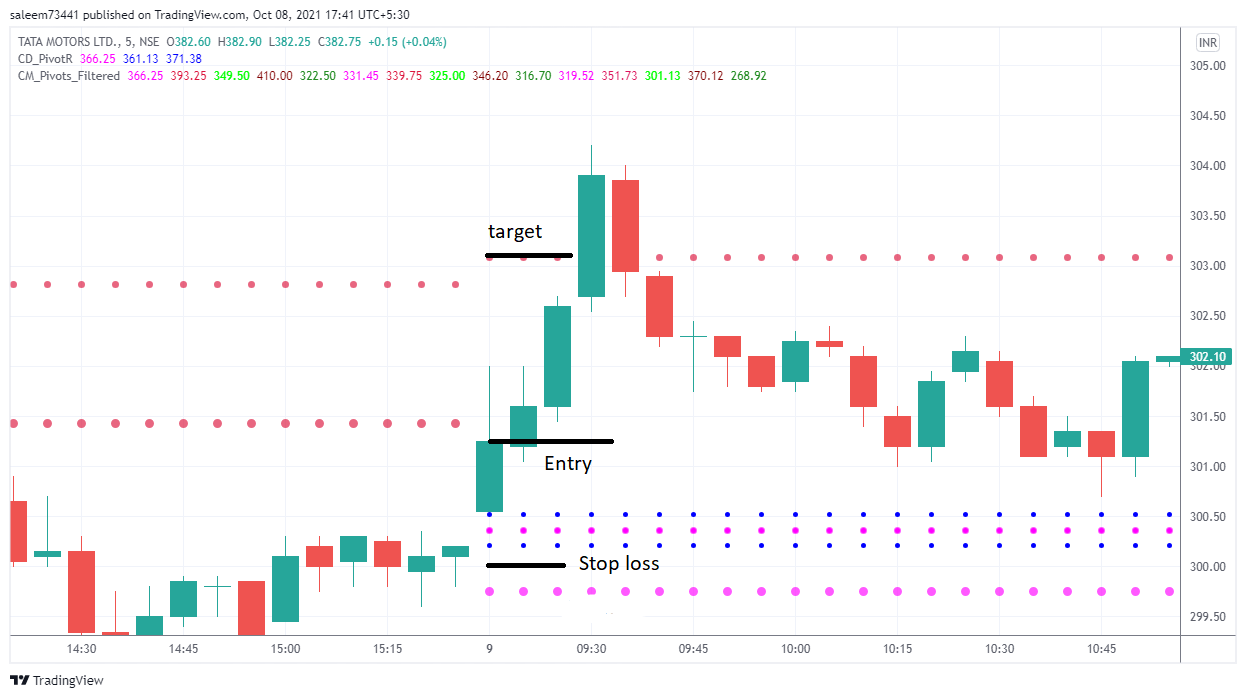
Entry: To enter in a trade using CPR in bullish view, you need to check whether the opening candle of stock breakouts the TC level and move upwards. You need to enter the trade above the candle high.
Stoploss: Placing a stop loss for this trade is a bit tricky, you always need to place the stop loss below the BC level leaving some gap.
Target: The target for this trade should be set for Resistance 1 or Previous day high. You can check the referral image below.
CPR Bearish View
If the stock is showing a bearish view that is when the market price of the stock remains lower (breakdown) than the BC level in CPR.
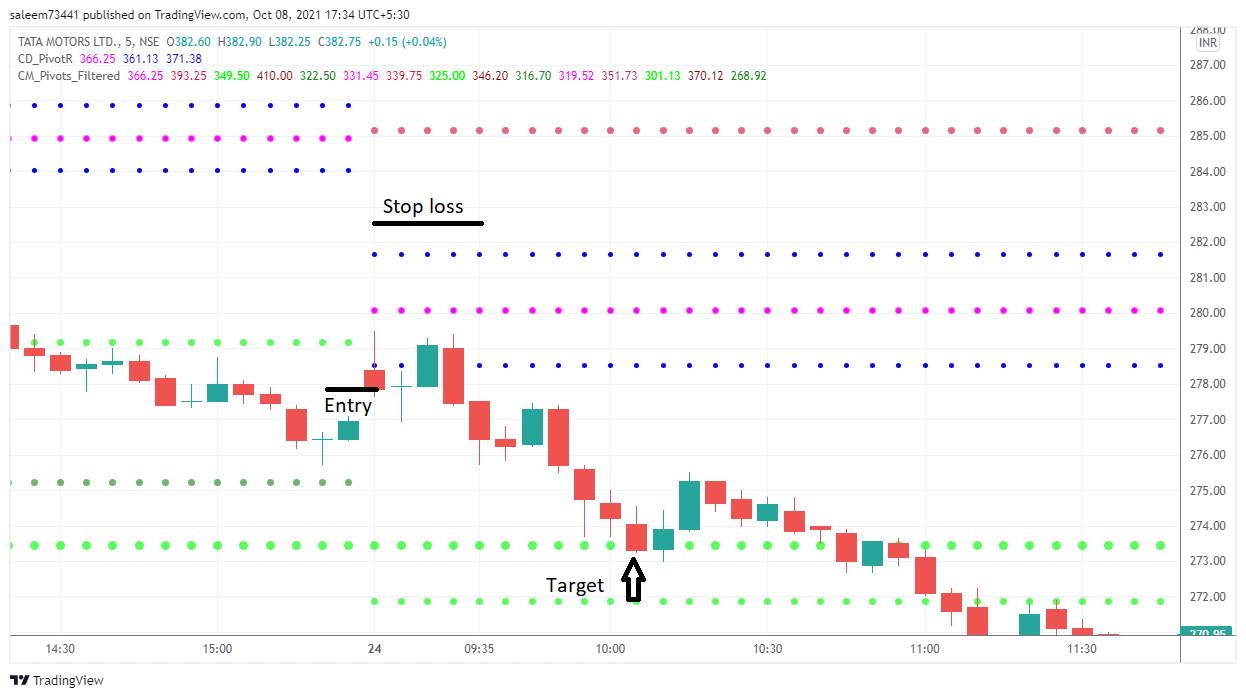
Entry: To enter in a trade using CPR in bearish view, you need to check whether the opening candle of stock breakdown the BC level and move downwards. You need to enter the trade Below the candle low.
Stoploss: You need to place the stop loss above the TC level leaving some gap. So that you can maintain the golden rule “Risk reward ratio of 2%”.
Target: The target for this trade should be set for Support 1 or Previous day low. You can check the referral image below.
Points to Remember
- When you plot the CPR, the previous month’s OHLC is referenced
- Previous week’s OHLC is a reference when you plot CPR for 30mins and 1-hour candles
- The previous day’s OHLC is referenced when you plot CPR for 1, 3, 5, 10, and 15 minutes candles
Central Pivot Range – Conclusion
It’s suggested to use CPR in a 5-minute chart. If you make trades based on CPR breakout with volume confirmation, then the success ratio can be as high as 70%. But don’t forget to put a stoploss to save your money from unexpected movements.